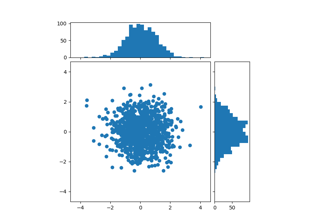
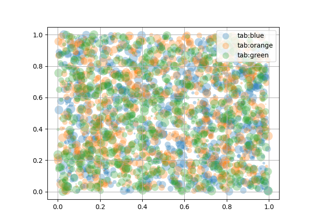
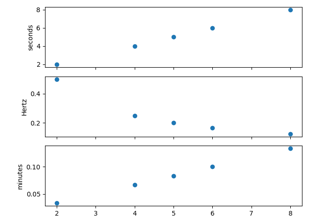
matplotlib.axes.Axes.scatter#
- Axes.scatter(x, y, s=None, c=None, marker=None, cmap=None, norm=None, vmin=None, vmax=None, alpha=None, linewidths=None, *, edgecolors=None, plotnonfinite=False, data=None, **kwargs)[source]#
A scatter plot of y vs. x with varying marker size and/or color.
- Parameters:
- x, yfloat or array-like, shape (n, )
The data positions.
- sfloat or array-like, shape (n, ), optional
The marker size in points**2 (typographic points are 1/72 in.). Default is
rcParams['lines.markersize'] ** 2.- carray-like or list of colors or color, optional
The marker colors. Possible values:
A scalar or sequence of n numbers to be mapped to colors using cmap and norm.
A 2D array in which the rows are RGB or RGBA.
A sequence of colors of length n.
A single color format string.
Note that c should not be a single numeric RGB or RGBA sequence because that is indistinguishable from an array of values to be colormapped. If you want to specify the same RGB or RGBA value for all points, use a 2D array with a single row. Otherwise, value-matching will have precedence in case of a size matching with x and y.
If you wish to specify a single color for all points prefer the color keyword argument.
Defaults to
None. In that case the marker color is determined by the value of color, facecolor or facecolors. In case those are not specified orNone, the marker color is determined by the next color of theAxes' current "shape and fill" color cycle. This cycle defaults torcParams["axes.prop_cycle"](default:cycler('color', ['#1f77b4', '#ff7f0e', '#2ca02c', '#d62728', '#9467bd', '#8c564b', '#e377c2', '#7f7f7f', '#bcbd22', '#17becf'])).- marker
MarkerStyle, default:rcParams["scatter.marker"](default:'o') The marker style. marker can be either an instance of the class or the text shorthand for a particular marker. See
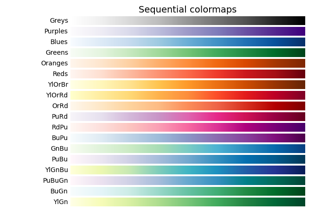
matplotlib.markersfor more information about marker styles.- cmapstr or
Colormap, default:rcParams["image.cmap"](default:'viridis') The Colormap instance or registered colormap name used to map scalar data to colors.
This parameter is ignored if c is RGB(A).
- normstr or
Normalize, optional The normalization method used to scale scalar data to the [0, 1] range before mapping to colors using cmap. By default, a linear scaling is used, mapping the lowest value to 0 and the highest to 1.
If given, this can be one of the following:
An instance of
Normalizeor one of its subclasses (see Colormap Normalization).A scale name, i.e. one of "linear", "log", "symlog", "logit", etc. For a list of available scales, call
matplotlib.scale.get_scale_names(). In that case, a suitableNormalizesubclass is dynamically generated and instantiated.
This parameter is ignored if c is RGB(A).
- vmin, vmaxfloat, optional
When using scalar data and no explicit norm, vmin and vmax define the data range that the colormap covers. By default, the colormap covers the complete value range of the supplied data. It is an error to use vmin/vmax when a norm instance is given (but using a
strnorm name together with vmin/vmax is acceptable).This parameter is ignored if c is RGB(A).
- alphafloat, default: None
The alpha blending value, between 0 (transparent) and 1 (opaque).
- linewidthsfloat or array-like, default:
rcParams["lines.linewidth"](default:1.5) The linewidth of the marker edges. Note: The default edgecolors is 'face'. You may want to change this as well.
- edgecolors{'face', 'none', None} or color or sequence of color, default:
rcParams["scatter.edgecolors"](default:'face') The edge color of the marker. Possible values:
'face': The edge color will always be the same as the face color.
'none': No patch boundary will be drawn.
A color or sequence of colors.
For non-filled markers, edgecolors is ignored. Instead, the color is determined like with 'face', i.e. from c, colors, or facecolors.
- plotnonfinitebool, default: False
Whether to plot points with nonfinite c (i.e.
inf,-infornan). IfTruethe points are drawn with the bad colormap color (seeColormap.set_bad).
- Returns:
- Other Parameters:
- dataindexable object, optional
If given, the following parameters also accept a string
s, which is interpreted asdata[s](unless this raises an exception):x, y, s, linewidths, edgecolors, c, facecolor, facecolors, color
- **kwargs
Collectionproperties
See also
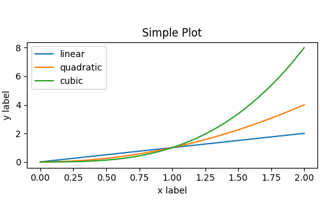
plotTo plot scatter plots when markers are identical in size and color.
Notes
The
plotfunction will be faster for scatterplots where markers don't vary in size or color.Any or all of x, y, s, and c may be masked arrays, in which case all masks will be combined and only unmasked points will be plotted.
Fundamentally, scatter works with 1D arrays; x, y, s, and c may be input as N-D arrays, but within scatter they will be flattened. The exception is c, which will be flattened only if its size matches the size of x and y.
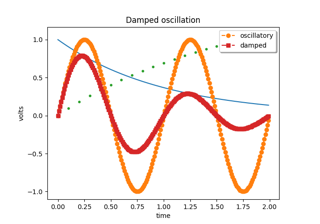
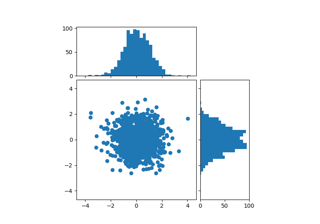
Examples using matplotlib.axes.Axes.scatter#
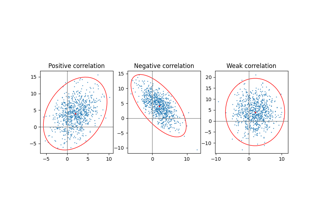
Plot a confidence ellipse of a two-dimensional dataset
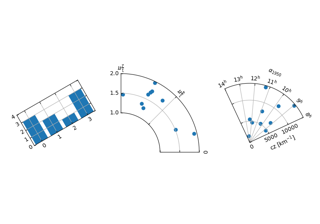

Select indices from a collection using polygon selector