matplotlib.axes.Axes.imshow#
- Axes.imshow(X, cmap=None, norm=None, *, aspect=None, interpolation=None, alpha=None, vmin=None, vmax=None, origin=None, extent=None, interpolation_stage=None, filternorm=True, filterrad=4.0, resample=None, url=None, data=None, **kwargs)[source]#
Display data as an image, i.e., on a 2D regular raster.
The input may either be actual RGB(A) data, or 2D scalar data, which will be rendered as a pseudocolor image. For displaying a grayscale image set up the colormapping using the parameters
cmap='gray', vmin=0, vmax=255.The number of pixels used to render an image is set by the Axes size and the dpi of the figure. This can lead to aliasing artifacts when the image is resampled because the displayed image size will usually not match the size of X (see Image antialiasing). The resampling can be controlled via the interpolation parameter and/or
rcParams["image.interpolation"](default:'antialiased').- Parameters:
- Xarray-like or PIL image
The image data. Supported array shapes are:
(M, N): an image with scalar data. The values are mapped to colors using normalization and a colormap. See parameters norm, cmap, vmin, vmax.
(M, N, 3): an image with RGB values (0-1 float or 0-255 int).
(M, N, 4): an image with RGBA values (0-1 float or 0-255 int), i.e. including transparency.
The first two dimensions (M, N) define the rows and columns of the image.
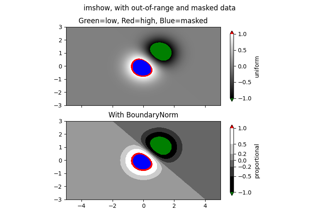
Out-of-range RGB(A) values are clipped.
- cmapstr or
Colormap, default:rcParams["image.cmap"](default:'viridis') The Colormap instance or registered colormap name used to map scalar data to colors.
This parameter is ignored if X is RGB(A).
- normstr or
Normalize, optional The normalization method used to scale scalar data to the [0, 1] range before mapping to colors using cmap. By default, a linear scaling is used, mapping the lowest value to 0 and the highest to 1.
If given, this can be one of the following:
An instance of
Normalizeor one of its subclasses (see Colormap Normalization).A scale name, i.e. one of "linear", "log", "symlog", "logit", etc. For a list of available scales, call
matplotlib.scale.get_scale_names(). In that case, a suitableNormalizesubclass is dynamically generated and instantiated.
This parameter is ignored if X is RGB(A).
- vmin, vmaxfloat, optional
When using scalar data and no explicit norm, vmin and vmax define the data range that the colormap covers. By default, the colormap covers the complete value range of the supplied data. It is an error to use vmin/vmax when a norm instance is given (but using a
strnorm name together with vmin/vmax is acceptable).This parameter is ignored if X is RGB(A).
- aspect{'equal', 'auto'} or float, default:
rcParams["image.aspect"](default:'equal') The aspect ratio of the Axes. This parameter is particularly relevant for images since it determines whether data pixels are square.
This parameter is a shortcut for explicitly calling
Axes.set_aspect. See there for further details.'equal': Ensures an aspect ratio of 1. Pixels will be square (unless pixel sizes are explicitly made non-square in data coordinates using extent).
'auto': The Axes is kept fixed and the aspect is adjusted so that the data fit in the Axes. In general, this will result in non-square pixels.
- interpolationstr, default:
rcParams["image.interpolation"](default:'antialiased') The interpolation method used.
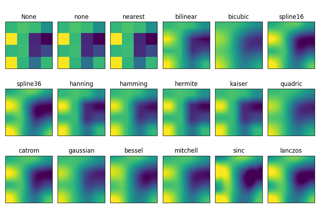
Supported values are 'none', 'antialiased', 'nearest', 'bilinear', 'bicubic', 'spline16', 'spline36', 'hanning', 'hamming', 'hermite', 'kaiser', 'quadric', 'catrom', 'gaussian', 'bessel', 'mitchell', 'sinc', 'lanczos', 'blackman'.
If interpolation is 'none', then no interpolation is performed on the Agg, ps, pdf and svg backends. Other backends will fall back to 'nearest'. Note that most SVG renderers perform interpolation at rendering and that the default interpolation method they implement may differ.
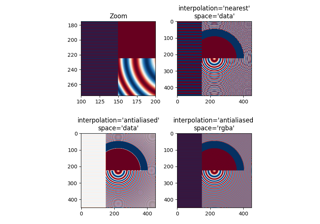
If interpolation is the default 'antialiased', then 'nearest' interpolation is used if the image is upsampled by more than a factor of three (i.e. the number of display pixels is at least three times the size of the data array). If the upsampling rate is smaller than 3, or the image is downsampled, then 'hanning' interpolation is used to act as an anti-aliasing filter, unless the image happens to be upsampled by exactly a factor of two or one.
See Interpolations for imshow for an overview of the supported interpolation methods, and Image antialiasing for a discussion of image antialiasing.
Some interpolation methods require an additional radius parameter, which can be set by filterrad. Additionally, the antigrain image resize filter is controlled by the parameter filternorm.
- interpolation_stage{'data', 'rgba'}, default: 'data'
If 'data', interpolation is carried out on the data provided by the user. If 'rgba', the interpolation is carried out after the colormapping has been applied (visual interpolation).
- alphafloat or array-like, optional
The alpha blending value, between 0 (transparent) and 1 (opaque). If alpha is an array, the alpha blending values are applied pixel by pixel, and alpha must have the same shape as X.
- origin{'upper', 'lower'}, default:
rcParams["image.origin"](default:'upper') Place the [0, 0] index of the array in the upper left or lower left corner of the Axes. The convention (the default) 'upper' is typically used for matrices and images.
Note that the vertical axis points upward for 'lower' but downward for 'upper'.
See the origin and extent in imshow tutorial for examples and a more detailed description.
- extentfloats (left, right, bottom, top), optional
The bounding box in data coordinates that the image will fill. These values may be unitful and match the units of the Axes. The image is stretched individually along x and y to fill the box.
The default extent is determined by the following conditions. Pixels have unit size in data coordinates. Their centers are on integer coordinates, and their center coordinates range from 0 to columns-1 horizontally and from 0 to rows-1 vertically.
Note that the direction of the vertical axis and thus the default values for top and bottom depend on origin:
For
origin == 'upper'the default is(-0.5, numcols-0.5, numrows-0.5, -0.5).For
origin == 'lower'the default is(-0.5, numcols-0.5, -0.5, numrows-0.5).
See the origin and extent in imshow tutorial for examples and a more detailed description.
- filternormbool, default: True
A parameter for the antigrain image resize filter (see the antigrain documentation). If filternorm is set, the filter normalizes integer values and corrects the rounding errors. It doesn't do anything with the source floating point values, it corrects only integers according to the rule of 1.0 which means that any sum of pixel weights must be equal to 1.0. So, the filter function must produce a graph of the proper shape.
- filterradfloat > 0, default: 4.0
The filter radius for filters that have a radius parameter, i.e. when interpolation is one of: 'sinc', 'lanczos' or 'blackman'.
- resamplebool, default:
rcParams["image.resample"](default:True) When True, use a full resampling method. When False, only resample when the output image is larger than the input image.
- urlstr, optional
Set the url of the created
AxesImage. SeeArtist.set_url.
- Returns:
- Other Parameters:
See also
matshowPlot a matrix or an array as an image.
Notes
Unless extent is used, pixel centers will be located at integer coordinates. In other words: the origin will coincide with the center of pixel (0, 0).
There are two common representations for RGB images with an alpha channel:
Straight (unassociated) alpha: R, G, and B channels represent the color of the pixel, disregarding its opacity.
Premultiplied (associated) alpha: R, G, and B channels represent the color of the pixel, adjusted for its opacity by multiplication.
imshowexpects RGB images adopting the straight (unassociated) alpha representation.
Examples using matplotlib.axes.Axes.imshow#
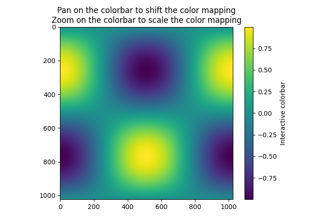
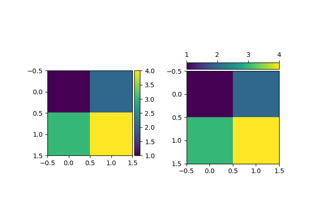
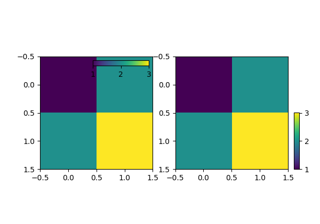
Controlling the position and size of colorbars with Inset Axes