Note
Click here to download the full example code
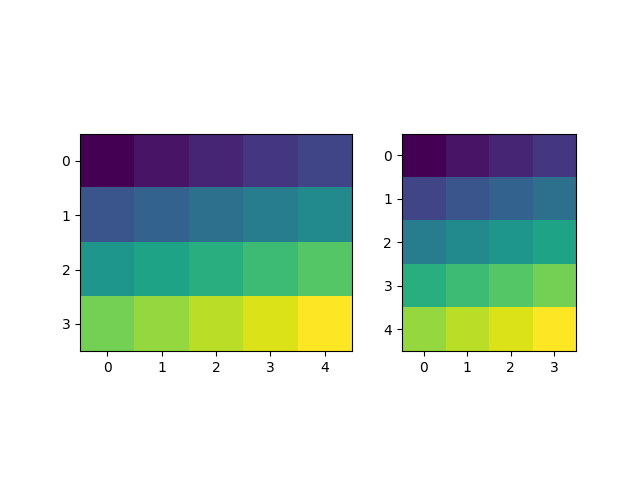
HBoxDivider and VBoxDivider demo#
Using an HBoxDivider to arrange subplots.
Note that both axes' location are adjusted so that they have equal heights while maintaining their aspect ratios.
import numpy as np
import matplotlib.pyplot as plt
from mpl_toolkits.axes_grid1.axes_divider import HBoxDivider, VBoxDivider
import mpl_toolkits.axes_grid1.axes_size as Size


arr1 = np.arange(20).reshape((4, 5))
arr2 = np.arange(20).reshape((5, 4))

fig, (ax1, ax2) = plt.subplots(1, 2)
ax1.imshow(arr1)
ax2.imshow(arr2)

pad = 0.5  # pad in inches
divider = HBoxDivider(
    fig, 111,
    horizontal=[Size.AxesX(ax1), Size.Fixed(pad), Size.AxesX(ax2)],
    vertical=[Size.AxesY(ax1), Size.Scaled(1), Size.AxesY(ax2)])
ax1.set_axes_locator(divider.new_locator(0))
ax2.set_axes_locator(divider.new_locator(2))

plt.show()
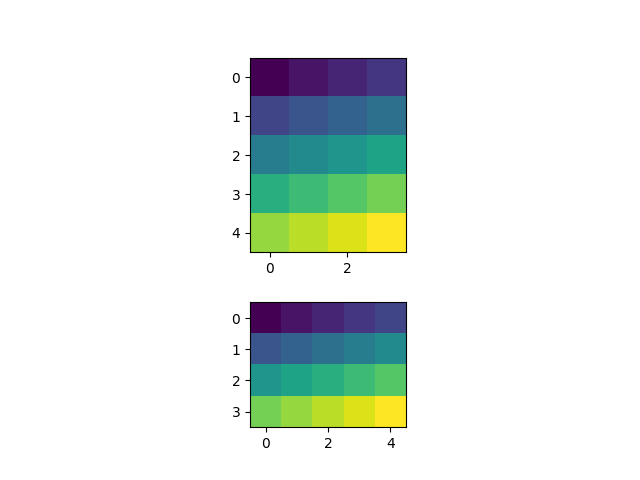
Using a VBoxDivider to arrange subplots.
Note that both axes' location are adjusted so that they have equal widths while maintaining their aspect ratios.
fig, (ax1, ax2) = plt.subplots(2, 1)
ax1.imshow(arr1)
ax2.imshow(arr2)

divider = VBoxDivider(
    fig, 111,
    horizontal=[Size.AxesX(ax1), Size.Scaled(1), Size.AxesX(ax2)],
    vertical=[Size.AxesY(ax1), Size.Fixed(pad), Size.AxesY(ax2)])

ax1.set_axes_locator(divider.new_locator(0))
ax2.set_axes_locator(divider.new_locator(2))

plt.show()