Note
Click here to download the full example code
Figure legend demo#
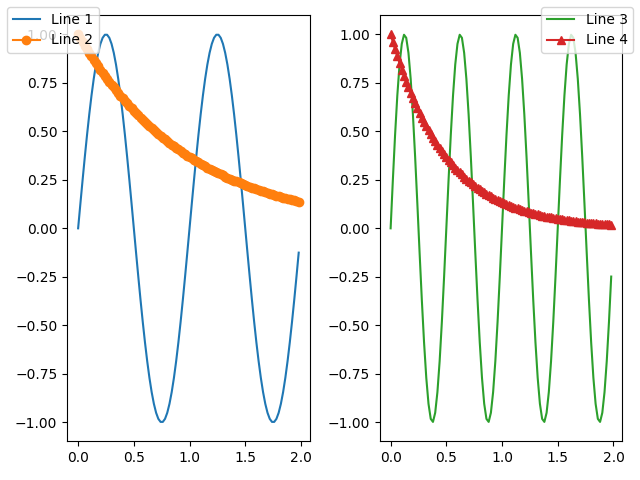
Instead of plotting a legend on each axis, a legend for all the artists on all the sub-axes of a figure can be plotted instead.
import numpy as np
import matplotlib.pyplot as plt

fig, axs = plt.subplots(1, 2)

x = np.arange(0.0, 2.0, 0.02)
y1 = np.sin(2 * np.pi * x)
y2 = np.exp(-x)
l1, = axs[0].plot(x, y1)
l2, = axs[0].plot(x, y2, marker='o')

y3 = np.sin(4 * np.pi * x)
y4 = np.exp(-2 * x)
l3, = axs[1].plot(x, y3, color='tab:green')
l4, = axs[1].plot(x, y4, color='tab:red', marker='^')

fig.legend((l1, l2), ('Line 1', 'Line 2'), loc='upper left')
fig.legend((l3, l4), ('Line 3', 'Line 4'), loc='upper right')

plt.tight_layout()
plt.show()
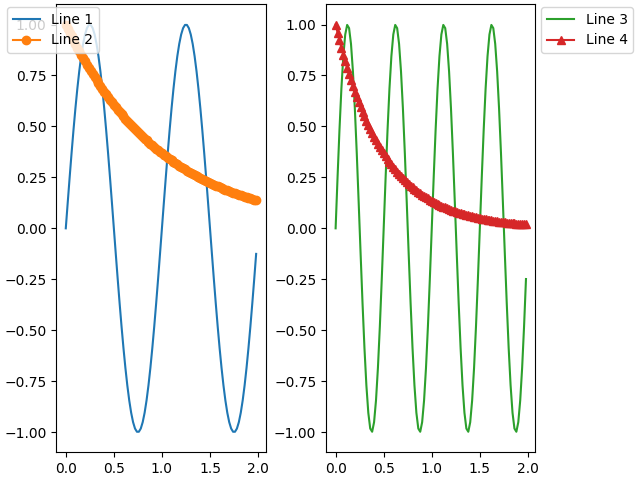
Sometimes we do not want the legend to overlap the axes. If you use constrained layout you can specify "outside right upper", and constrained layout will make room for the legend.
fig, axs = plt.subplots(1, 2, layout='constrained')

x = np.arange(0.0, 2.0, 0.02)
y1 = np.sin(2 * np.pi * x)
y2 = np.exp(-x)
l1, = axs[0].plot(x, y1)
l2, = axs[0].plot(x, y2, marker='o')

y3 = np.sin(4 * np.pi * x)
y4 = np.exp(-2 * x)
l3, = axs[1].plot(x, y3, color='tab:green')
l4, = axs[1].plot(x, y4, color='tab:red', marker='^')

fig.legend((l1, l2), ('Line 1', 'Line 2'), loc='upper left')
fig.legend((l3, l4), ('Line 3', 'Line 4'), loc='outside right upper')

plt.show()
Total running time of the script: ( 0 minutes 1.313 seconds)