Note
Click here to download the full example code
Error bar rendering on polar axis#
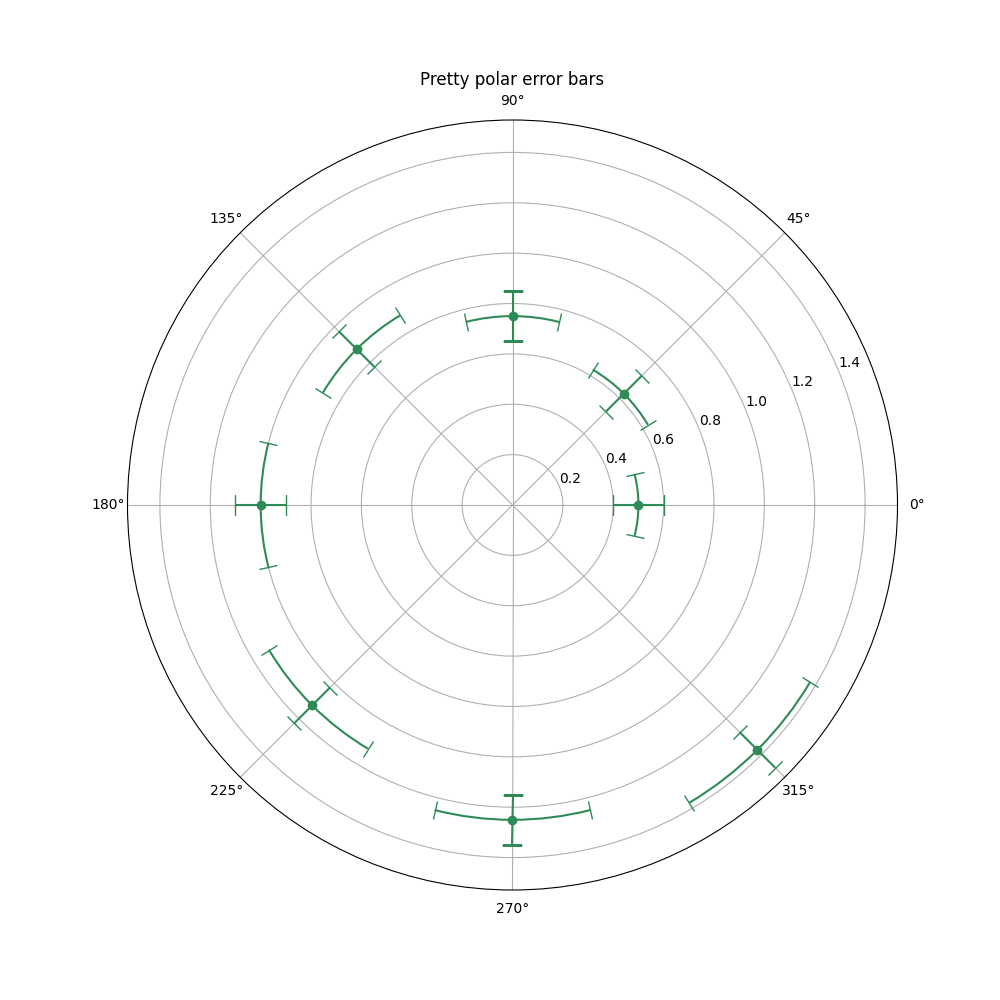
Demo of error bar plot in polar coordinates. Theta error bars are curved lines ended with caps oriented towards the center. Radius error bars are straight lines oriented towards center with perpendicular caps.
import numpy as np
import matplotlib.pyplot as plt

theta = np.arange(0, 2 * np.pi, np.pi / 4)
r = theta / np.pi / 2 + 0.5

fig = plt.figure(figsize=(10, 10))
ax = fig.add_subplot(projection='polar')
ax.errorbar(theta, r, xerr=0.25, yerr=0.1, capsize=7, fmt="o", c="seagreen")
ax.set_title("Pretty polar error bars")
plt.show()
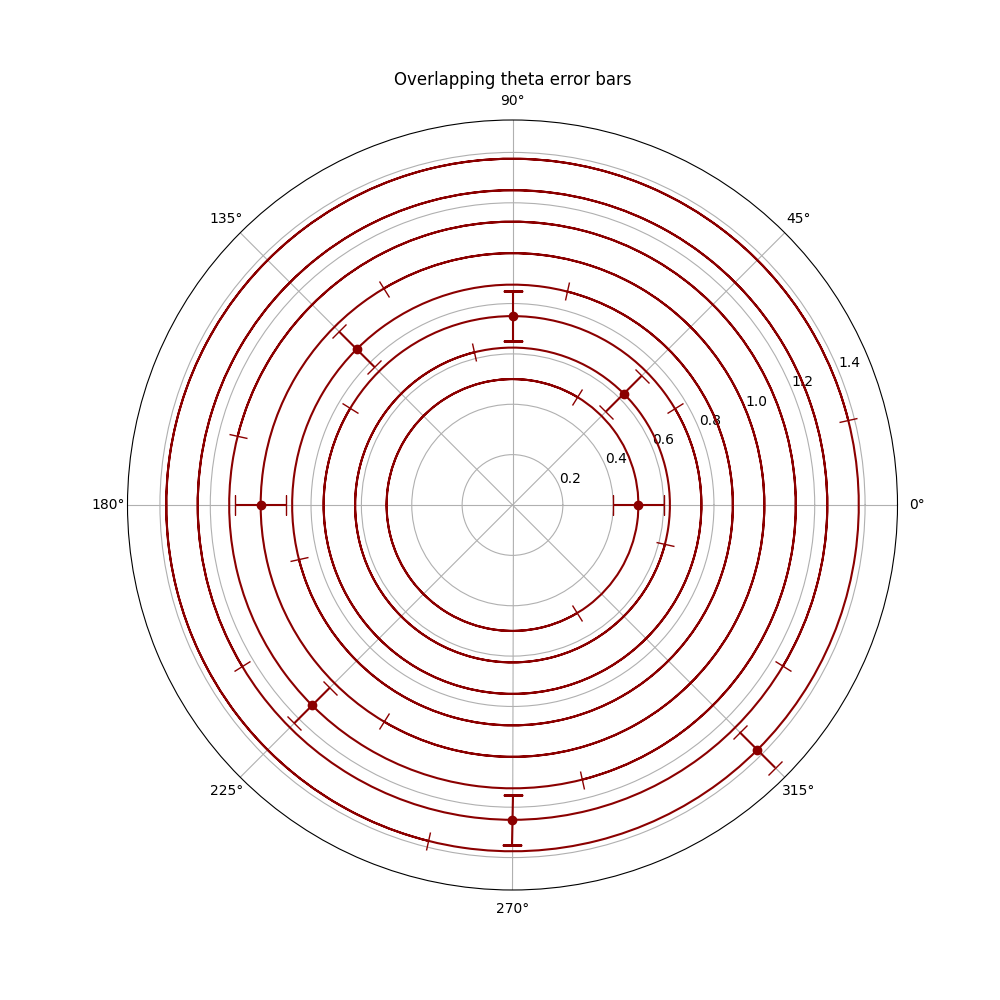
Please acknowledge that large theta error bars will be overlapping. This may reduce readability of the output plot. See example figure below:
fig = plt.figure(figsize=(10, 10))
ax = fig.add_subplot(projection='polar')
ax.errorbar(theta, r, xerr=5.25, yerr=0.1, capsize=7, fmt="o", c="darkred")
ax.set_title("Overlapping theta error bars")
plt.show()
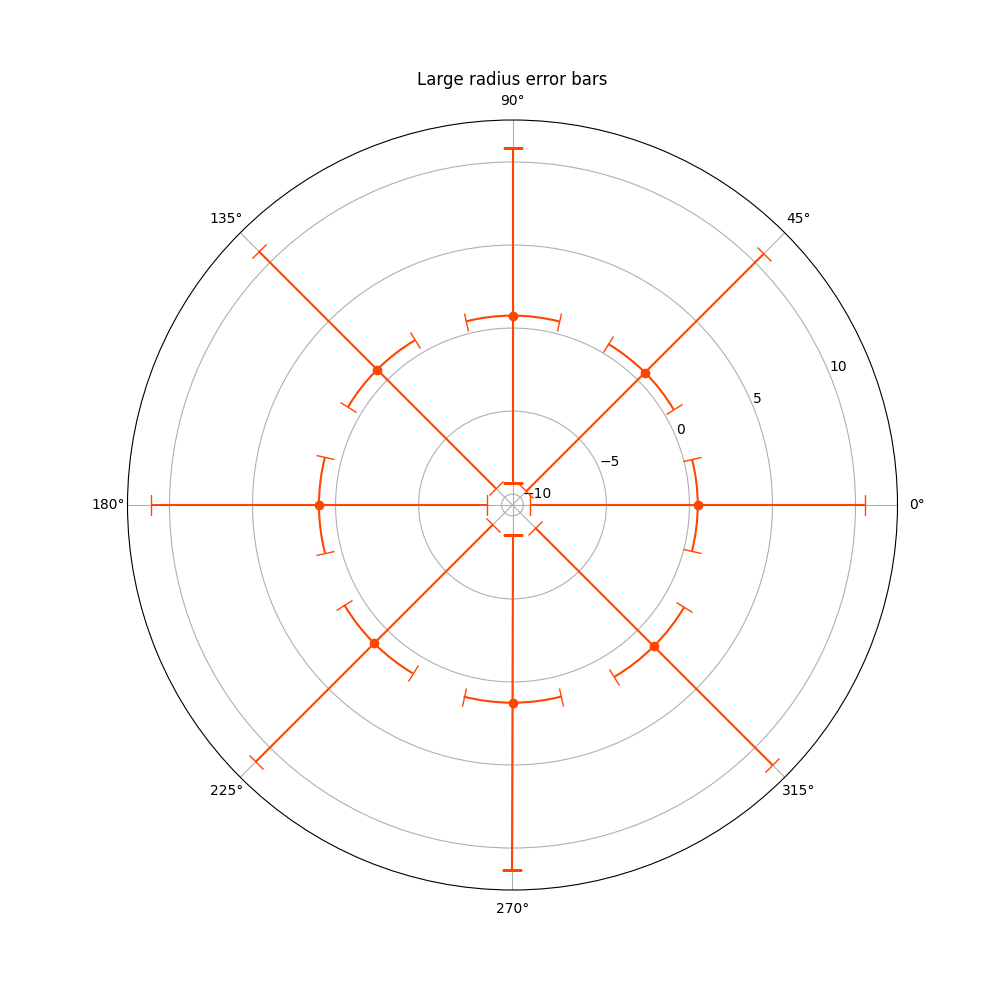
On the other hand, large radius error bars will never overlap, they just lead to unwanted scale in the data, reducing the displayed range.
fig = plt.figure(figsize=(10, 10))
ax = fig.add_subplot(projection='polar')
ax.errorbar(theta, r, xerr=0.25, yerr=10.1, capsize=7, fmt="o", c="orangered")
ax.set_title("Large radius error bars")
plt.show()
References
The use of the following functions, methods, classes and modules is shown in this example:
Total running time of the script: ( 0 minutes 3.834 seconds)