matplotlib.axes.Axes.grid#
- Axes.grid(visible=None, which='major', axis='both', **kwargs)[source]#
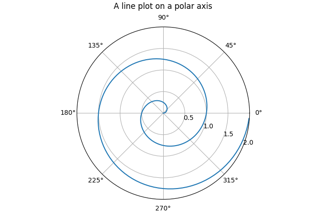
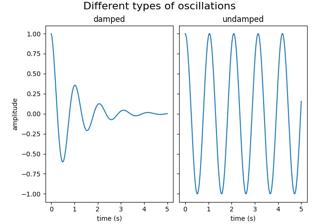
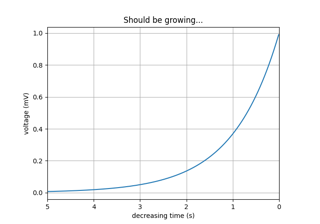
Configure the grid lines.
- Parameters:
- visiblebool or None, optional
Whether to show the grid lines. If any kwargs are supplied, it is assumed you want the grid on and visible will be set to True.
If visible is None and there are no kwargs, this toggles the visibility of the lines.
- which{'major', 'minor', 'both'}, optional
The grid lines to apply the changes on.
- axis{'both', 'x', 'y'}, optional
The axis to apply the changes on.
- **kwargs
Line2Dproperties Define the line properties of the grid, e.g.:
grid(color='r', linestyle='-', linewidth=2)
Valid keyword arguments are:
Property
Description
a filter function, which takes a (m, n, 3) float array and a dpi value, and returns a (m, n, 3) array and two offsets from the bottom left corner of the image
scalar or None
bool
antialiasedor aabool
bool
Patch or (Path, Transform) or None
coloror ccolor
CapStyleor {'butt', 'projecting', 'round'}JoinStyleor {'miter', 'round', 'bevel'}sequence of floats (on/off ink in points) or (None, None)
(2, N) array or two 1D arrays
drawstyleor ds{'default', 'steps', 'steps-pre', 'steps-mid', 'steps-post'}, default: 'default'
{'full', 'left', 'right', 'bottom', 'top', 'none'}
color or None
str
bool
object
linestyleor ls{'-', '--', '-.', ':', '', (offset, on-off-seq), ...}
linewidthor lwfloat
marker style string,
PathorMarkerStylemarkeredgecoloror meccolor
markeredgewidthor mewfloat
markerfacecoloror mfccolor
markerfacecoloraltor mfcaltcolor
markersizeor msfloat
None or int or (int, int) or slice or list[int] or float or (float, float) or list[bool]
bool
float or callable[[Artist, Event], tuple[bool, dict]]
unknown
bool
(scale: float, length: float, randomness: float)
bool or None
CapStyleor {'butt', 'projecting', 'round'}JoinStyleor {'miter', 'round', 'bevel'}unknown
str
bool
1D array
1D array
float
Notes
The axis is drawn as a unit, so the effective zorder for drawing the grid is determined by the zorder of each axis, not by the zorder of the
Line2Dobjects comprising the grid. Therefore, to set grid zorder, useset_axisbelowor, for more control, call theset_zordermethod of each axis.
Examples using matplotlib.axes.Axes.grid#
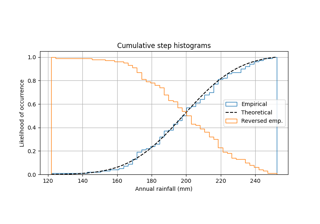
Using histograms to plot a cumulative distribution