matplotlib.axes.Axes.set_yscale#

Axes.set_yscale(value, **kwargs)[source]#

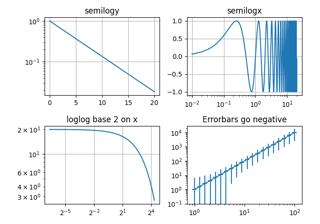
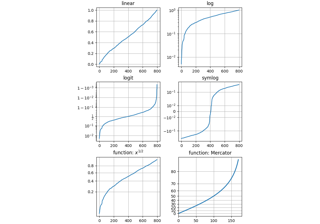
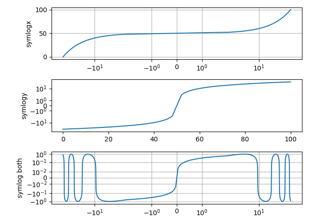
Set the yaxis' scale.

Parameters:
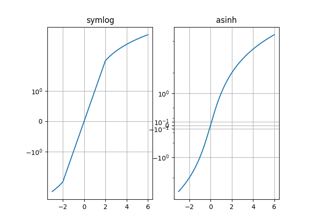
value{"linear", "log", "symlog", "logit", ...} or ScaleBase

The axis scale type to apply.

**kwargs

Different keyword arguments are accepted, depending on the scale. See the respective class keyword arguments:

Notes

By default, Matplotlib supports the above mentioned scales. Additionally, custom scales may be registered using matplotlib.scale.register_scale. These scales can then also be used here.

Examples using matplotlib.axes.Axes.set_yscale#

Markevery Demo

Markevery Demo

Markevery Demo
Artist customization in box plots

Artist customization in box plots

Artist customization in box plots
Boxplot drawer function

Boxplot drawer function

Boxplot drawer function
Different ways of specifying error bars

Different ways of specifying error bars

Different ways of specifying error bars
Stock prices over 32 years

Stock prices over 32 years

Stock prices over 32 years
Asinh Demo

Asinh Demo

Asinh Demo
Loglog Aspect

Loglog Aspect

Loglog Aspect
Log Bar

Log Bar

Log Bar
Log Demo

Log Demo

Log Demo
Scales

Scales

Scales
Symlog Demo

Symlog Demo

Symlog Demo