matplotlib.axis.XAxis.set_ticks_position#
- XAxis.set_ticks_position(position)[source]#
Set the ticks position.
- Parameters:
- position{'top', 'bottom', 'both', 'default', 'none'}
'both' sets the ticks to appear on both positions, but does not change the tick labels. 'default' resets the tick positions to the default: ticks on both positions, labels at bottom. 'none' can be used if you don't want any ticks. 'none' and 'both' affect only the ticks, not the labels.
Examples using matplotlib.axis.XAxis.set_ticks_position#
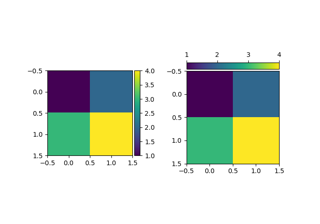
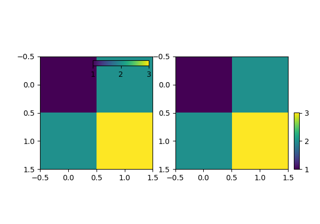
Controlling the position and size of colorbars with Inset Axes
Controlling the position and size of colorbars with Inset Axes