matplotlib.figure.SubFigure.subplots#
- SubFigure.subplots(nrows=1, ncols=1, *, sharex=False, sharey=False, squeeze=True, width_ratios=None, height_ratios=None, subplot_kw=None, gridspec_kw=None)[source]#
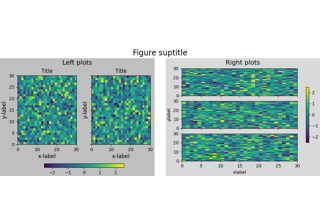
Add a set of subplots to this figure.
This utility wrapper makes it convenient to create common layouts of subplots in a single call.
- Parameters:
- nrows, ncolsint, default: 1
Number of rows/columns of the subplot grid.
- sharex, shareybool or {'none', 'all', 'row', 'col'}, default: False
Controls sharing of x-axis (sharex) or y-axis (sharey):
True or 'all': x- or y-axis will be shared among all subplots.
False or 'none': each subplot x- or y-axis will be independent.
'row': each subplot row will share an x- or y-axis.
'col': each subplot column will share an x- or y-axis.
When subplots have a shared x-axis along a column, only the x tick labels of the bottom subplot are created. Similarly, when subplots have a shared y-axis along a row, only the y tick labels of the first column subplot are created. To later turn other subplots' ticklabels on, use
tick_params.When subplots have a shared axis that has units, calling
Axis.set_unitswill update each axis with the new units.- squeezebool, default: True
If True, extra dimensions are squeezed out from the returned array of Axes:
if only one subplot is constructed (nrows=ncols=1), the resulting single Axes object is returned as a scalar.
for Nx1 or 1xM subplots, the returned object is a 1D numpy object array of Axes objects.
for NxM, subplots with N>1 and M>1 are returned as a 2D array.
If False, no squeezing at all is done: the returned Axes object is always a 2D array containing Axes instances, even if it ends up being 1x1.
- width_ratiosarray-like of length ncols, optional
Defines the relative widths of the columns. Each column gets a relative width of
width_ratios[i] / sum(width_ratios). If not given, all columns will have the same width. Equivalent togridspec_kw={'width_ratios': [...]}.- height_ratiosarray-like of length nrows, optional
Defines the relative heights of the rows. Each row gets a relative height of
height_ratios[i] / sum(height_ratios). If not given, all rows will have the same height. Equivalent togridspec_kw={'height_ratios': [...]}.- subplot_kwdict, optional
Dict with keywords passed to the
Figure.add_subplotcall used to create each subplot.- gridspec_kwdict, optional
Dict with keywords passed to the
GridSpecconstructor used to create the grid the subplots are placed on.
- Returns:
Examples
# First create some toy data:
x = np.linspace(0, 2*np.pi, 400)
y = np.sin(x**2)

# Create a figure
fig = plt.figure()

# Create a subplot
ax = fig.subplots()
ax.plot(x, y)
ax.set_title('Simple plot')

# Create two subplots and unpack the output array immediately
ax1, ax2 = fig.subplots(1, 2, sharey=True)
ax1.plot(x, y)
ax1.set_title('Sharing Y axis')
ax2.scatter(x, y)

# Create four polar Axes and access them through the returned array
axes = fig.subplots(2, 2, subplot_kw=dict(projection='polar'))
axes[0, 0].plot(x, y)
axes[1, 1].scatter(x, y)

# Share an X-axis with each column of subplots
fig.subplots(2, 2, sharex='col')

# Share a Y-axis with each row of subplots
fig.subplots(2, 2, sharey='row')

# Share both X- and Y-axes with all subplots
fig.subplots(2, 2, sharex='all', sharey='all')

# Note that this is the same as
fig.subplots(2, 2, sharex=True, sharey=True)