matplotlib.figure.Figure.autofmt_xdate#
- Figure.autofmt_xdate(bottom=0.2, rotation=30, ha='right', which='major')[source]#
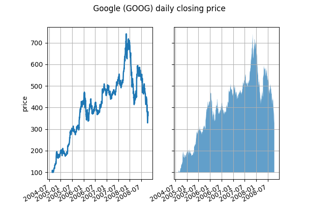
Date ticklabels often overlap, so it is useful to rotate them and right align them. Also, a common use case is a number of subplots with shared x-axis where the x-axis is date data. The ticklabels are often long, and it helps to rotate them on the bottom subplot and turn them off on other subplots, as well as turn off xlabels.
- Parameters:
- bottomfloat, default: 0.2
The bottom of the subplots for
subplots_adjust.- rotationfloat, default: 30 degrees
The rotation angle of the xtick labels in degrees.
- ha{'left', 'center', 'right'}, default: 'right'
The horizontal alignment of the xticklabels.
- which{'major', 'minor', 'both'}, default: 'major'
Selects which ticklabels to rotate.