matplotlib.figure.Figure.text#
- Figure.text(x, y, s, fontdict=None, **kwargs)[source]#
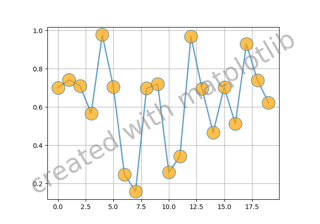
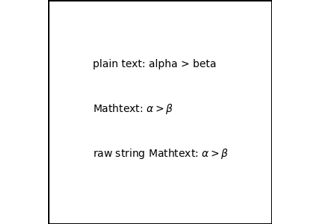
Add text to figure.
- Parameters:
- x, yfloat
The position to place the text. By default, this is in figure coordinates, floats in [0, 1]. The coordinate system can be changed using the transform keyword.
- sstr
The text string.
- fontdictdict, optional
A dictionary to override the default text properties. If not given, the defaults are determined by
rcParams["font.*"]. Properties passed as kwargs override the corresponding ones given in fontdict.
- Returns:
- Other Parameters:
- **kwargs
Textproperties Other miscellaneous text parameters.
Property
Description
a filter function, which takes a (m, n, 3) float array and a dpi value, and returns a (m, n, 3) array and two offsets from the bottom left corner of the image
scalar or None
bool
bool
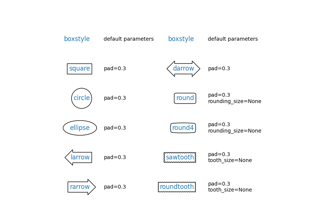
dict with properties for
patches.FancyBboxPatchunknown
unknown
unknown
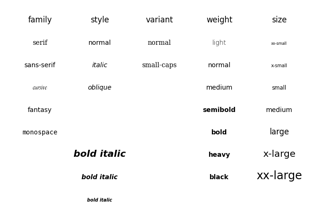
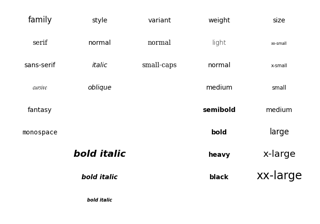
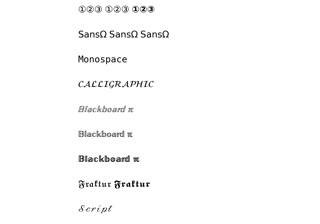
coloror cfontfamilyor family or fontname{FONTNAME, 'serif', 'sans-serif', 'cursive', 'fantasy', 'monospace'}
fontpropertiesor font or font_propertiesfontsizeor sizefloat or {'xx-small', 'x-small', 'small', 'medium', 'large', 'x-large', 'xx-large'}
fontstretchor stretch{a numeric value in range 0-1000, 'ultra-condensed', 'extra-condensed', 'condensed', 'semi-condensed', 'normal', 'semi-expanded', 'expanded', 'extra-expanded', 'ultra-expanded'}
fontstyleor style{'normal', 'italic', 'oblique'}
fontvariantor variant{'normal', 'small-caps'}
fontweightor weight{a numeric value in range 0-1000, 'ultralight', 'light', 'normal', 'regular', 'book', 'medium', 'roman', 'semibold', 'demibold', 'demi', 'bold', 'heavy', 'extra bold', 'black'}
str
horizontalalignmentor ha{'left', 'center', 'right'}
bool
object
float (multiple of font size)
str
bool
multialignmentor ma{'left', 'right', 'center'}
bool
list of
AbstractPathEffectNone or bool or float or callable
(float, float)
bool
float or {'vertical', 'horizontal'}
{None, 'default', 'anchor'}
(scale: float, length: float, randomness: float)
bool or None
object
bool
str
bool, default:
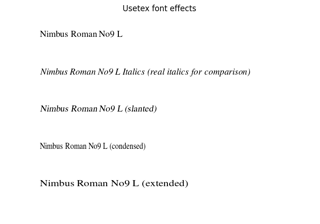
rcParams["text.usetex"](default:False)verticalalignmentor va{'baseline', 'bottom', 'center', 'center_baseline', 'top'}
bool
bool
float
float
float
- **kwargs
See also