matplotlib.figure.Figure.subfigures#
- Figure.subfigures(nrows=1, ncols=1, squeeze=True, wspace=None, hspace=None, width_ratios=None, height_ratios=None, **kwargs)[source]#
Add a set of subfigures to this figure or subfigure.
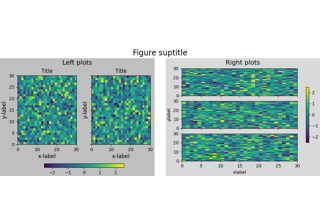
A subfigure has the same artist methods as a figure, and is logically the same as a figure, but cannot print itself. See Figure subfigures.
Note
The subfigure concept is new in v3.4, and the API is still provisional.
- Parameters:
- nrows, ncolsint, default: 1
Number of rows/columns of the subfigure grid.
- squeezebool, default: True
If True, extra dimensions are squeezed out from the returned array of subfigures.
- wspace, hspacefloat, default: None
The amount of width/height reserved for space between subfigures, expressed as a fraction of the average subfigure width/height. If not given, the values will be inferred from rcParams if using constrained layout (see
ConstrainedLayoutEngine), or zero if not using a layout engine.- width_ratiosarray-like of length ncols, optional
Defines the relative widths of the columns. Each column gets a relative width of
width_ratios[i] / sum(width_ratios). If not given, all columns will have the same width.- height_ratiosarray-like of length nrows, optional
Defines the relative heights of the rows. Each row gets a relative height of
height_ratios[i] / sum(height_ratios). If not given, all rows will have the same height.
Examples using matplotlib.figure.Figure.subfigures#


Complex and semantic figure composition (subplot_mosaic)