matplotlib.figure.Figure.add_subplot#
- Figure.add_subplot(*args, **kwargs)[source]#
Add an
Axesto the figure as part of a subplot arrangement.Call signatures:
add_subplot(nrows, ncols, index, **kwargs)
add_subplot(pos, **kwargs)
add_subplot(ax)
add_subplot()
- Parameters:
- *argsint, (int, int, index), or
SubplotSpec, default: (1, 1, 1) The position of the subplot described by one of
Three integers (nrows, ncols, index). The subplot will take the index position on a grid with nrows rows and ncols columns. index starts at 1 in the upper left corner and increases to the right. index can also be a two-tuple specifying the (first, last) indices (1-based, and including last) of the subplot, e.g.,
fig.add_subplot(3, 1, (1, 2))makes a subplot that spans the upper 2/3 of the figure.A 3-digit integer. The digits are interpreted as if given separately as three single-digit integers, i.e.
fig.add_subplot(235)is the same asfig.add_subplot(2, 3, 5). Note that this can only be used if there are no more than 9 subplots.A
SubplotSpec.
In rare circumstances,
add_subplotmay be called with a single argument, a subplot Axes instance already created in the present figure but not in the figure's list of Axes.- projection{None, 'aitoff', 'hammer', 'lambert', 'mollweide', 'polar', 'rectilinear', str}, optional
The projection type of the subplot (
Axes). str is the name of a custom projection, seeprojections. The default None results in a 'rectilinear' projection.- polarbool, default: False
If True, equivalent to projection='polar'.
- axes_classsubclass type of
Axes, optional The
axes.Axessubclass that is instantiated. This parameter is incompatible with projection and polar. See axisartist for examples.- sharex, sharey
Axes, optional Share the x or y
axiswith sharex and/or sharey. The axis will have the same limits, ticks, and scale as the axis of the shared Axes.- labelstr
A label for the returned Axes.
- *argsint, (int, int, index), or
- Returns:
AxesThe Axes of the subplot. The returned Axes can actually be an instance of a subclass, such as
projections.polar.PolarAxesfor polar projections.
- Other Parameters:
- **kwargs
This method also takes the keyword arguments for the returned Axes base class; except for the figure argument. The keyword arguments for the rectilinear base class
Axescan be found in the following table but there might also be other keyword arguments if another projection is used.Property
Description
{'box', 'datalim'}
a filter function, which takes a (m, n, 3) float array and a dpi value, and returns a (m, n, 3) array and two offsets from the bottom left corner of the image
scalar or None
(float, float) or {'C', 'SW', 'S', 'SE', 'E', 'NE', ...}
bool
{'auto', 'equal'} or float
bool
unknown
unknown
Callable[[Axes, Renderer], Bbox]
bool or 'line'
float or None
BboxBaseor Nonebool
Patch or (Path, Transform) or None
facecoloror fcbool or "auto"
bool
str
bool
object
bool
bool
unknown
list of
AbstractPathEffectNone or bool or float or callable
[left, bottom, width, height] or
Bboxfloat or None
bool
(scale: float, length: float, randomness: float)
bool or None
unknown
str
str
bool
(lower: float, upper: float)
str
(left: float, right: float)
float greater than -0.5
unknown
unknown
unknown
(lower: float, upper: float)
str
(bottom: float, top: float)
float greater than -0.5
unknown
unknown
unknown
float
Examples
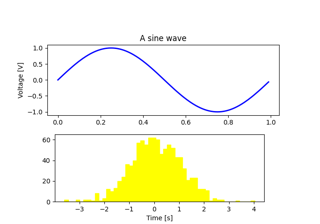
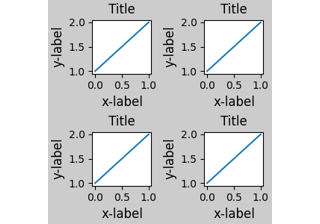
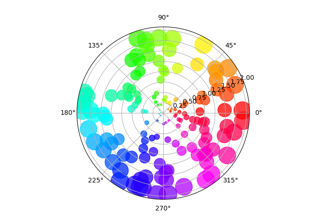
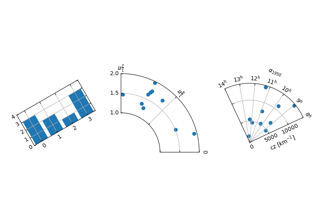
fig = plt.figure()

fig.add_subplot(231)
ax1 = fig.add_subplot(2, 3, 1)  # equivalent but more general

fig.add_subplot(232, frameon=False)  # subplot with no frame
fig.add_subplot(233, projection='polar')  # polar subplot
fig.add_subplot(234, sharex=ax1)  # subplot sharing x-axis with ax1
fig.add_subplot(235, facecolor="red")  # red subplot

ax1.remove()  # delete ax1 from the figure
fig.add_subplot(ax1)  # add ax1 back to the figure
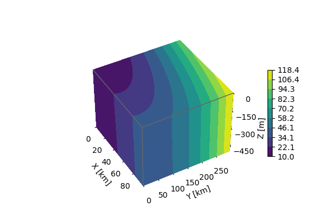
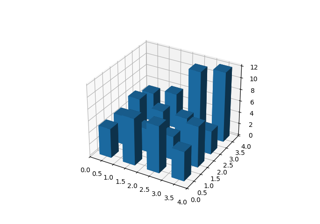
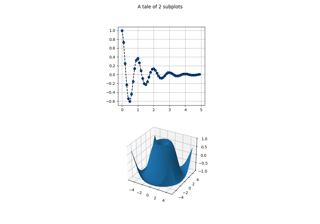
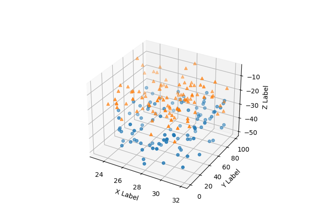
Examples using matplotlib.figure.Figure.add_subplot#
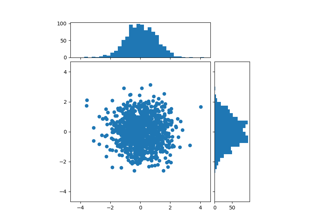
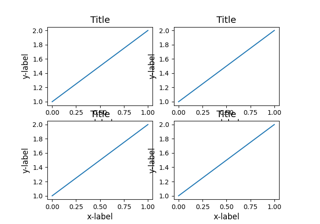

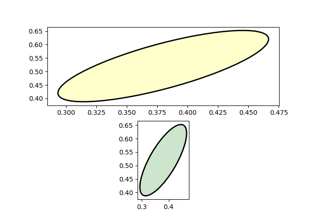
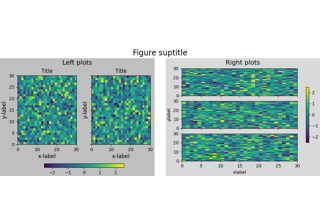
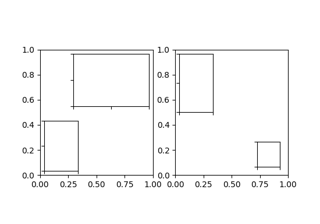
Combining two subplots using subplots and GridSpec
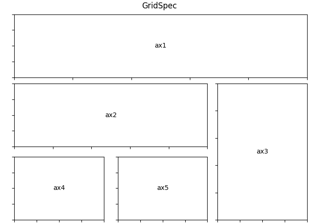
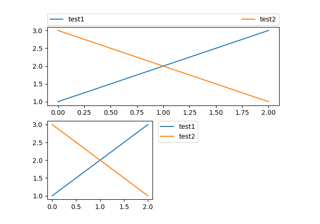
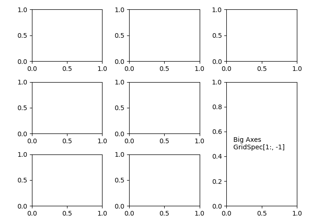
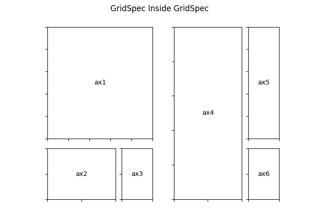
Using Gridspec to make multi-column/row subplot layouts


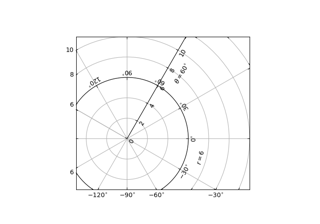


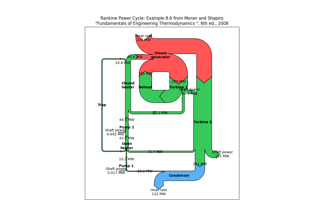

SkewT-logP diagram: using transforms and custom projections