matplotlib.figure.Figure.colorbar#
- Figure.colorbar(mappable, cax=None, ax=None, use_gridspec=True, **kwargs)[source]#
Add a colorbar to a plot.
- Parameters:
- mappable
The
matplotlib.cm.ScalarMappable(i.e.,AxesImage,ContourSet, etc.) described by this colorbar. This argument is mandatory for theFigure.colorbarmethod but optional for thepyplot.colorbarfunction, which sets the default to the current image.Note that one can create a
ScalarMappable"on-the-fly" to generate colorbars not attached to a previously drawn artist, e.g.fig.colorbar(cm.ScalarMappable(norm=norm, cmap=cmap), ax=ax)
- cax
Axes, optional Axes into which the colorbar will be drawn. If
None, then a new Axes is created and the space for it will be stolen from the Axes(s) specified in ax.- ax
Axesor iterable ornumpy.ndarrayof Axes, optional The one or more parent Axes from which space for a new colorbar Axes will be stolen. This parameter is only used if cax is not set.
Defaults to the Axes that contains the mappable used to create the colorbar.
- use_gridspecbool, optional
If cax is
None, a new cax is created as an instance of Axes. If ax is positioned with a subplotspec and use_gridspec isTrue, then cax is also positioned with a subplotspec.
- Returns:
- colorbar
Colorbar
- colorbar
- Other Parameters:
- locationNone or {'left', 'right', 'top', 'bottom'}
The location, relative to the parent Axes, where the colorbar Axes is created. It also determines the orientation of the colorbar (colorbars on the left and right are vertical, colorbars at the top and bottom are horizontal). If None, the location will come from the orientation if it is set (vertical colorbars on the right, horizontal ones at the bottom), or default to 'right' if orientation is unset.
- orientationNone or {'vertical', 'horizontal'}
The orientation of the colorbar. It is preferable to set the location of the colorbar, as that also determines the orientation; passing incompatible values for location and orientation raises an exception.
- fractionfloat, default: 0.15
Fraction of original Axes to use for colorbar.
- shrinkfloat, default: 1.0
Fraction by which to multiply the size of the colorbar.
- aspectfloat, default: 20
Ratio of long to short dimensions.
- padfloat, default: 0.05 if vertical, 0.15 if horizontal
Fraction of original Axes between colorbar and new image Axes.
- anchor(float, float), optional
The anchor point of the colorbar Axes. Defaults to (0.0, 0.5) if vertical; (0.5, 1.0) if horizontal.
- panchor(float, float), or False, optional
The anchor point of the colorbar parent Axes. If False, the parent axes' anchor will be unchanged. Defaults to (1.0, 0.5) if vertical; (0.5, 0.0) if horizontal.
- extend{'neither', 'both', 'min', 'max'}
Make pointed end(s) for out-of-range values (unless 'neither'). These are set for a given colormap using the colormap set_under and set_over methods.
- extendfrac{None, 'auto', length, lengths}
If set to None, both the minimum and maximum triangular colorbar extensions will have a length of 5% of the interior colorbar length (this is the default setting).
If set to 'auto', makes the triangular colorbar extensions the same lengths as the interior boxes (when spacing is set to 'uniform') or the same lengths as the respective adjacent interior boxes (when spacing is set to 'proportional').
If a scalar, indicates the length of both the minimum and maximum triangular colorbar extensions as a fraction of the interior colorbar length. A two-element sequence of fractions may also be given, indicating the lengths of the minimum and maximum colorbar extensions respectively as a fraction of the interior colorbar length.
- extendrectbool
If False the minimum and maximum colorbar extensions will be triangular (the default). If True the extensions will be rectangular.
- spacing{'uniform', 'proportional'}
For discrete colorbars (
BoundaryNormor contours), 'uniform' gives each color the same space; 'proportional' makes the space proportional to the data interval.- ticksNone or list of ticks or Locator
If None, ticks are determined automatically from the input.
- formatNone or str or Formatter
If None,
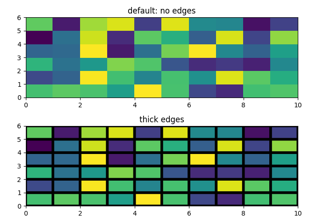
ScalarFormatteris used. Format strings, e.g.,"%4.2e"or"{x:.2e}", are supported. An alternativeFormattermay be given instead.- drawedgesbool
Whether to draw lines at color boundaries.
- labelstr
The label on the colorbar's long axis.
- boundaries, valuesNone or a sequence
If unset, the colormap will be displayed on a 0-1 scale. If sequences, values must have a length 1 less than boundaries. For each region delimited by adjacent entries in boundaries, the color mapped to the corresponding value in values will be used. Normally only useful for indexed colors (i.e.
norm=NoNorm()) or other unusual circumstances.
Notes
If mappable is a
ContourSet, its extend kwarg is included automatically.The shrink kwarg provides a simple way to scale the colorbar with respect to the Axes. Note that if cax is specified, it determines the size of the colorbar, and shrink and aspect are ignored.
For more precise control, you can manually specify the positions of the axes objects in which the mappable and the colorbar are drawn. In this case, do not use any of the Axes properties kwargs.
It is known that some vector graphics viewers (svg and pdf) render white gaps between segments of the colorbar. This is due to bugs in the viewers, not Matplotlib. As a workaround, the colorbar can be rendered with overlapping segments:
cbar = colorbar()
cbar.solids.set_edgecolor("face")
draw()
However, this has negative consequences in other circumstances, e.g. with semi-transparent images (alpha < 1) and colorbar extensions; therefore, this workaround is not used by default (see issue #1188).
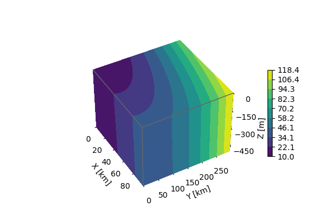
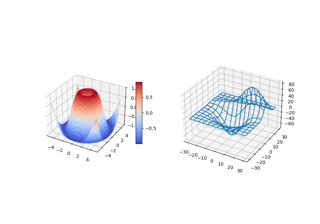
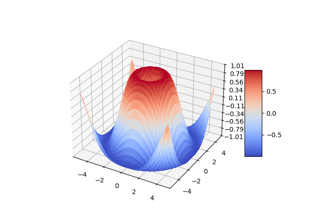
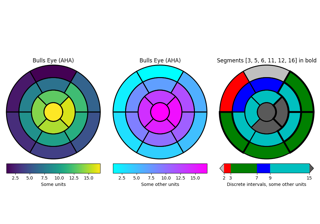
Examples using matplotlib.figure.Figure.colorbar#


Controlling the position and size of colorbars with Inset Axes