Note
Go to the end to download the full example code.
Multiline text#
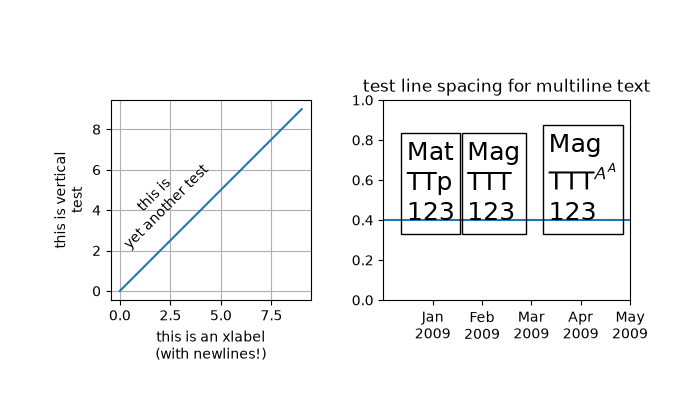
Texts may contain newlines to create multiline text.
The text alignment of the individual lines can be controlled by the
multialignment parameter. If not set, the alignment of the lines is inferred from
the horizontalalignment and verticalalignment parameters, which primarily
control the alignment of the bounding box of the text to its anchor point; e.g. if the
text has the anchor point to its right, all text lines will be aligned to the right
so that they pick up that anchor point.
When using mutli-line labels, it is recommended to use a layout manager (e.g.
layout="constrained") to ensure that there is enough space for the labels..
import matplotlib.pyplot as plt

fig, ax = plt.subplots(layout="constrained")

ax.bar(range(6), [0.3, 0.5, 0.8, 1.5, 2.5, 8], alpha=0.3)

ax.set_ylabel('labels are centered,\nso is their multi-line text by default')
ax.set_xlabel('xlabel with\nmultialignment="left"', multialignment="left")

ax.text(
    4.5, 6,
    'these lines\n'
    'are right aligned\n'
    'because of horizontalalignment',
    horizontalalignment='right',
)

ax.text(
    4.5, 4,
    'but\n'
    'we can override this\n'
    'with an explicit multialingment="left"',
    horizontalalignment='right',
    multialignment='left',
)

plt.show()
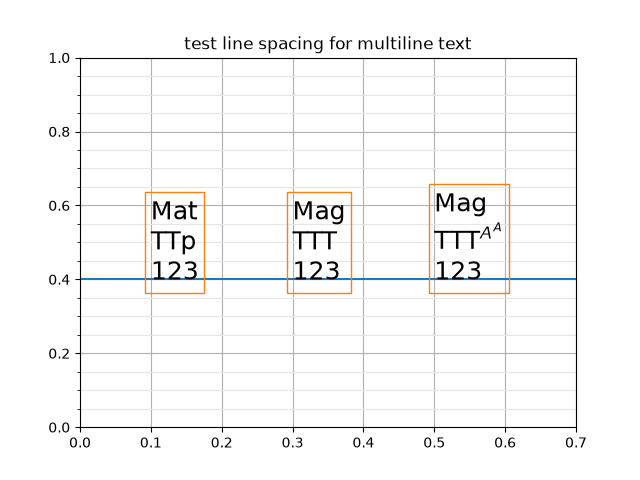
Each line has the same height irrespective of the used characters unless there is math text involved, which may need more vertical space
fig, ax = plt.subplots()

ax.text(0.1, 0.4, "Mat\nTTp\n123", size=18,
        va="baseline", bbox=dict(fc="none", ec="tab:orange"))

ax.text(0.3, 0.4, "Mag\nTTT\n123", size=18,
        va="baseline", bbox=dict(fc="none", ec="tab:orange"))

ax.text(0.5, 0.4, "Mag\nTTT$^{A^A}$\n123", size=18,
        va="baseline", bbox=dict(fc="none", ec="tab:orange"))

ax.axhline(0.4)
ax.set_title("test line spacing for multiline text")
ax.set_xlim(0, 0.7)
ax.yaxis.minorticks_on()
ax.yaxis.set_tick_params(which="minor", grid_color="0.9")
ax.grid(which="both")

plt.show()
Total running time of the script: (0 minutes 1.059 seconds)