Note
Go to the end to download the full example code.
Hatchcolor Demo#
The color of the hatch can be set using the hatchcolor parameter. The following
examples show how to use the hatchcolor parameter to set the color of the hatch
in Patch and Collection.
See also Hatch demo for more usage examples of hatching.
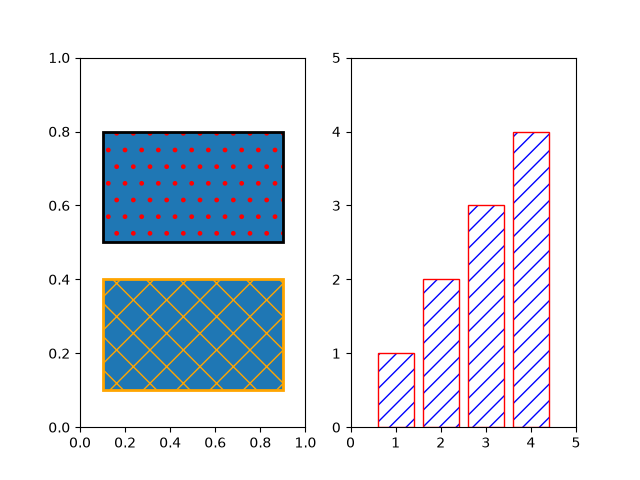
Patch Hatchcolor#
This example shows how to use the hatchcolor parameter to set the color of
the hatch in a rectangle and a bar plot. The hatchcolor parameter is available for
Patch, child classes of Patch, and methods that pass through to Patch.
import matplotlib.pyplot as plt
import numpy as np

import matplotlib.cm as cm
from matplotlib.patches import Rectangle

fig, (ax1, ax2) = plt.subplots(1, 2)

# Rectangle with red hatch color and black edge color
ax1.add_patch(Rectangle((0.1, 0.5), 0.8, 0.3, hatch=".", hatchcolor='red',
                        edgecolor='black', lw=2))
# If hatchcolor is not passed, the hatch will match the edge color
ax1.add_patch(Rectangle((0.1, 0.1), 0.8, 0.3, hatch='x', edgecolor='orange', lw=2))

x = np.arange(1, 5)
y = np.arange(1, 5)

ax2.bar(x, y, facecolor='none', edgecolor='red', hatch='//', hatchcolor='blue')
ax2.set_xlim(0, 5)
ax2.set_ylim(0, 5)
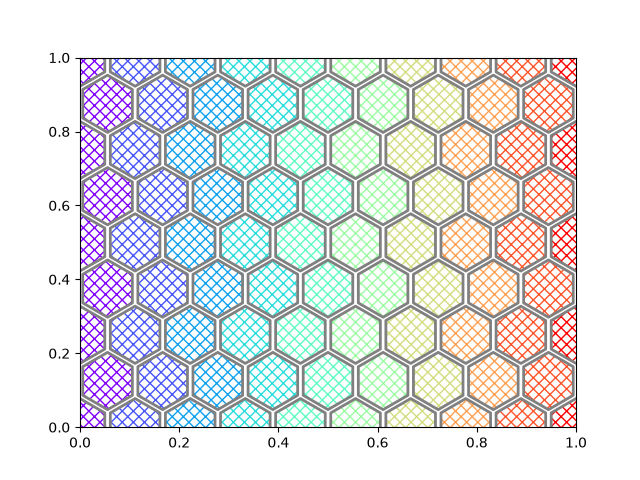
Collection Hatchcolor#
The following example shows how to use the hatchcolor parameter to set the color of
the hatch in a scatter plot. The hatchcolor parameter can also be passed to
Collection, child classes of Collection, and methods that pass
through to Collection.
fig, ax = plt.subplots()

num_points_x = 10
num_points_y = 9
x = np.linspace(0, 1, num_points_x)
y = np.linspace(0, 1, num_points_y)

X, Y = np.meshgrid(x, y)
X[1::2, :] += (x[1] - x[0]) / 2  # stagger every alternate row

# As ax.scatter (PathCollection) is drawn row by row, setting hatchcolors to the
# first row is enough, as the colors will be cycled through for the next rows.
colors = [cm.rainbow(val) for val in x]

ax.scatter(
    X.ravel(),
    Y.ravel(),
    s=1700,
    facecolor="none",
    edgecolor="gray",
    linewidth=2,
    marker="h",  # Use hexagon as marker
    hatch="xxx",
    hatchcolor=colors,
)
ax.set_xlim(0, 1)
ax.set_ylim(0, 1)

plt.show()
References
The use of the following functions, methods, classes and modules is shown in this example:
Total running time of the script: (0 minutes 1.016 seconds)