Note
Go to the end to download the full example code.
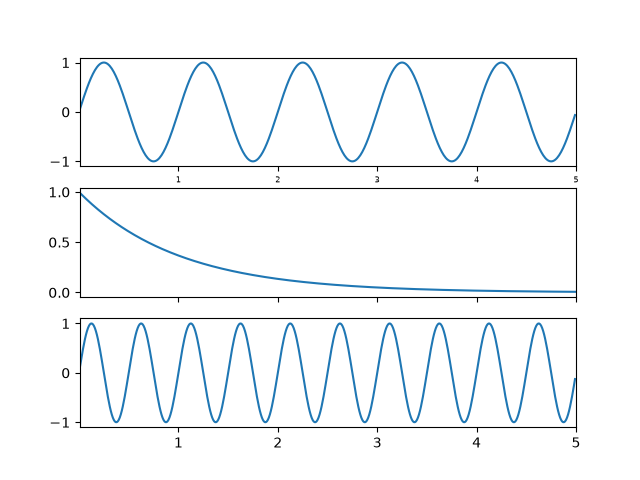
Shared axis#
Use axis sharing when you want to compare data across multiple subplots, and want to
ensure they are on the same scale. To do so, pass sharex=True and/or sharey=True
to subplots.
This ensures the x- or y-axis limits are synchronized across the subplots. Autoscaling considers the data on all Axes; therefore, any limit changes, including interactive zoom and pan, will affect all shared axes.
The plot below illustrates this by showing two different time-series and using sharex to ensure the times are aligned.
For more info see Sharing axes.
import matplotlib.pyplot as plt
import numpy as np

t1 = np.linspace(0, 8, 201)
y1 = np.sin(2 * np.pi * t1)
t2 = np.linspace(2, 10, 201)
y2 = 20 * np.cos(2 * np.pi * t2)**2 * np.exp(-0.3*t2)

fig, (ax1, ax2) = plt.subplots(2, sharex=True)

ax1.plot(t1, y1)
ax1.set_ylabel("Signal 1")

ax2.plot(t2, y2)
ax2.set_ylabel("Signal 2")
ax2.set_xlabel("Time (s)")

plt.show()