Note
Go to the end to download the full example code.
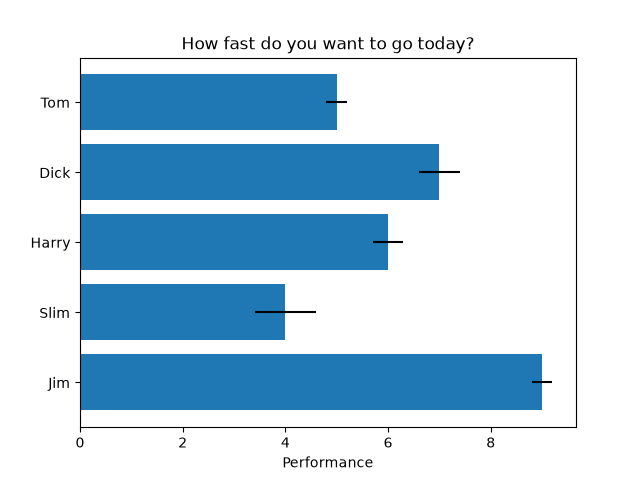
Horizontal bar chart#
This example showcases a simple horizontal bar chart.
import matplotlib.pyplot as plt

fig, ax = plt.subplots()

# Example data
people = ('Tom', 'Dick', 'Harry', 'Slim', 'Jim')
performance = [5, 7, 6, 4, 9]
error = [0.2, 0.4, 0.3, 0.6, 0.2]

ax.barh(people, performance, xerr=error, align='center')
ax.yaxis.set_inverted(True)  # arrange data from top to bottom
ax.set_xlabel('Performance')
ax.set_title('How fast do you want to go today?')

plt.show()