matplotlib.pyplot.figure#
- matplotlib.pyplot.figure(num=None, figsize=None, dpi=None, *, facecolor=None, edgecolor=None, frameon=True, FigureClass=<class 'matplotlib.figure.Figure'>, clear=False, **kwargs)[source]#
Create a new figure, or activate an existing figure.
- Parameters:
- numint or str or
FigureorSubFigure, optional A unique identifier for the figure.
If a figure with that identifier already exists, this figure is made active and returned. An integer refers to the
Figure.numberattribute, a string refers to the figure label.If there is no figure with the identifier or num is not given, a new figure is created, made active and returned. If num is an int, it will be used for the
Figure.numberattribute, otherwise, an auto-generated integer value is used (starting at 1 and incremented for each new figure). If num is a string, the figure label and the window title is set to this value. If num is aSubFigure, its parentFigureis activated.- figsize(float, float), default:
rcParams["figure.figsize"](default:[6.4, 4.8]) Width, height in inches.
- dpifloat, default:
rcParams["figure.dpi"](default:100.0) The resolution of the figure in dots-per-inch.
- facecolorcolor, default:
rcParams["figure.facecolor"](default:'white') The background color.
- edgecolorcolor, default:
rcParams["figure.edgecolor"](default:'white') The border color.
- frameonbool, default: True
If False, suppress drawing the figure frame.
- FigureClasssubclass of
Figure If set, an instance of this subclass will be created, rather than a plain
Figure.- clearbool, default: False
If True and the figure already exists, then it is cleared.
- layout{'constrained', 'tight',
LayoutEngine, None}, default: None The layout mechanism for positioning of plot elements to avoid overlapping Axes decorations (labels, ticks, etc). Note that layout managers can measurably slow down figure display. Defaults to None (but see the documentation of the
Figureconstructor regarding the interaction with rcParams).- **kwargs
Additional keyword arguments are passed to the
Figureconstructor.
- numint or str or
- Returns:
Notes
Newly created figures are passed to the
new_managermethod or thenew_figure_managerfunction provided by the current backend, which install a canvas and a manager on the figure.If you are creating many figures, make sure you explicitly call
pyplot.closeon the figures you are not using, because this will enable pyplot to properly clean up the memory.rcParamsdefines the default values, which can be modified in the matplotlibrc file.
Examples using matplotlib.pyplot.figure#


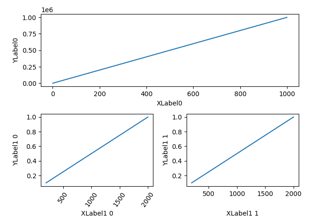
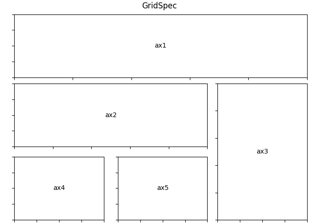
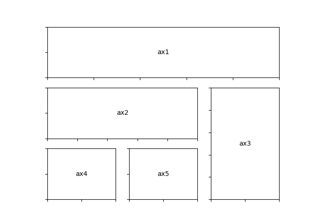
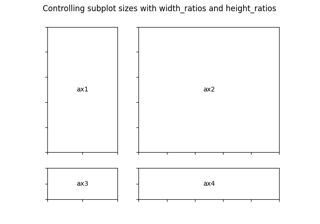
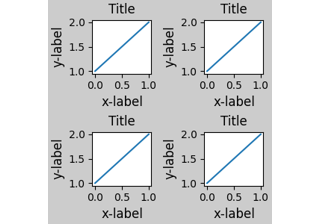
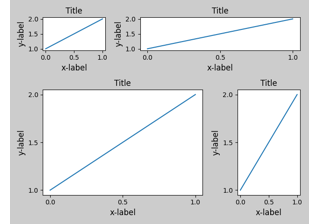
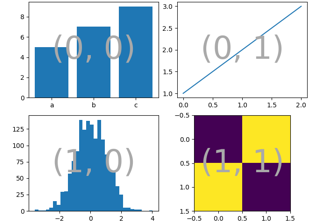
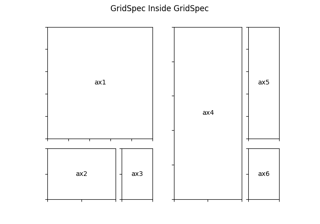
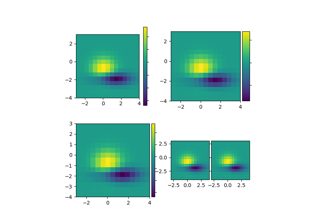
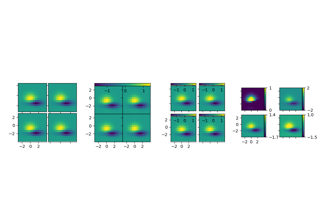
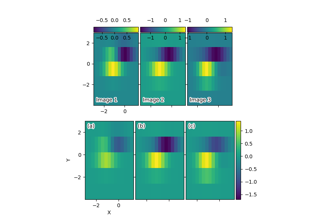
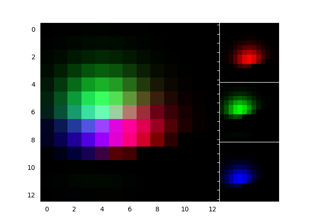
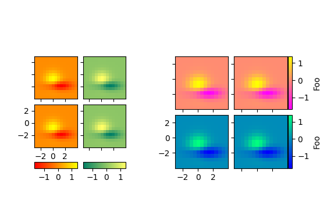
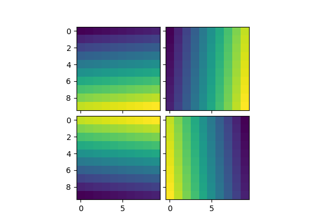
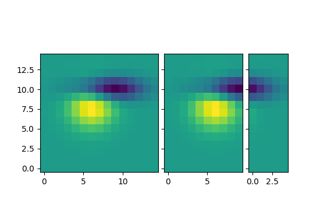
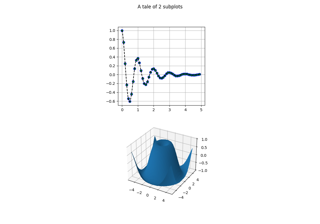
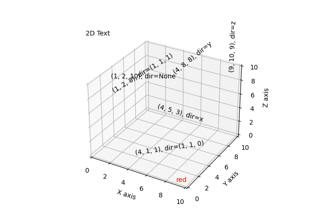
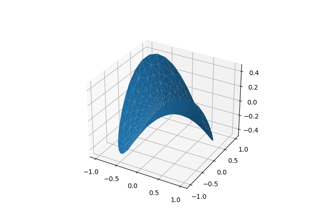
Using Gridspec to make multi-column/row subplot layouts
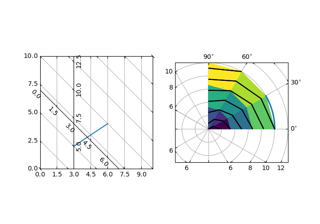


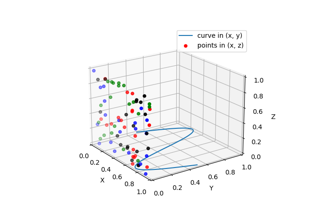
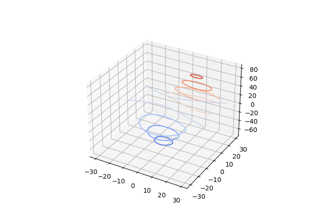
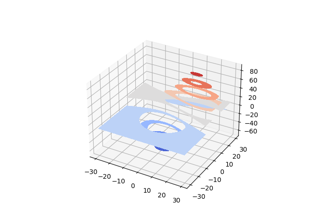
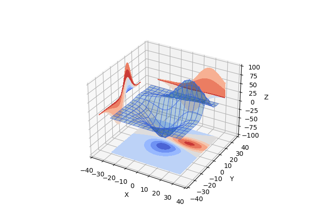
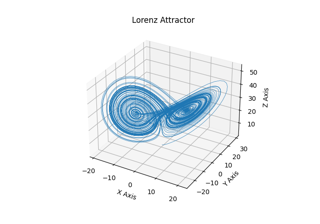
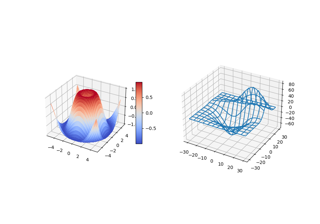
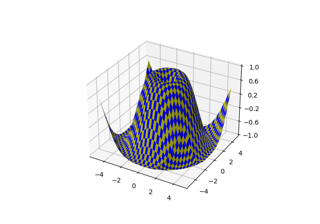
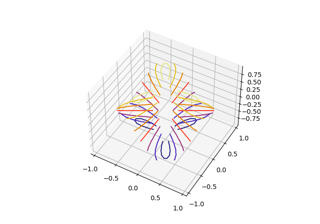
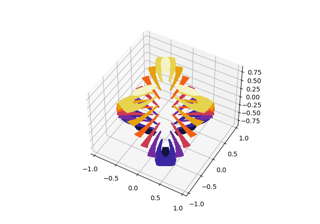
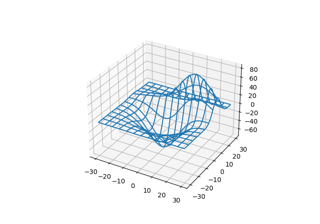
Plot contour (level) curves in 3D using the extend3d option
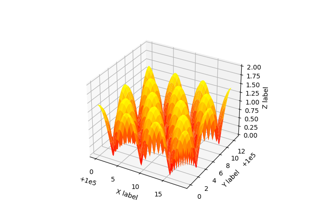

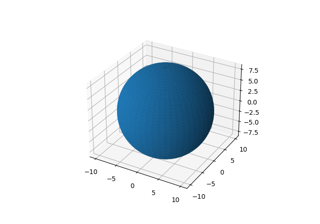
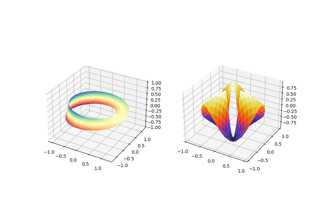
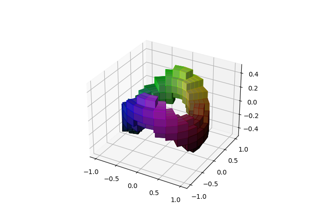
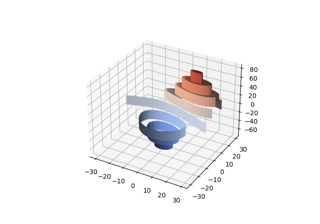
3D voxel / volumetric plot with cylindrical coordinates

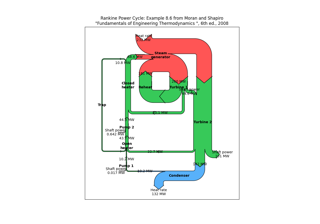
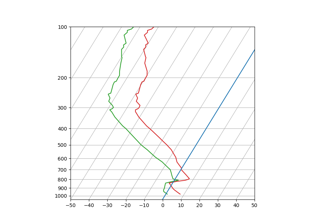
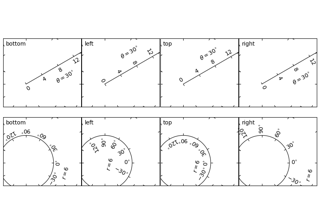
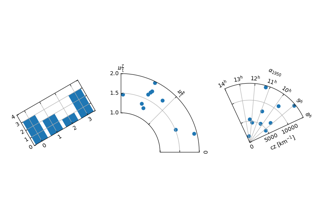
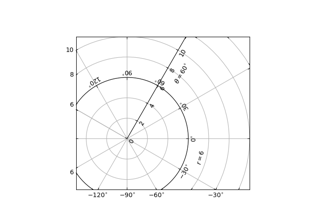
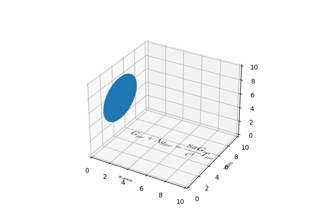
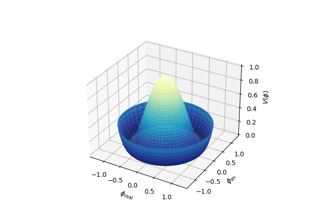
SkewT-logP diagram: using transforms and custom projections