matplotlib.axes.Axes.set_aspect#
- Axes.set_aspect(aspect, adjustable=None, anchor=None, share=False)[source]#
Set the aspect ratio of the axes scaling, i.e. y/x-scale.
- Parameters:
- aspect{'auto', 'equal'} or float
Possible values:
'auto': fill the position rectangle with data.
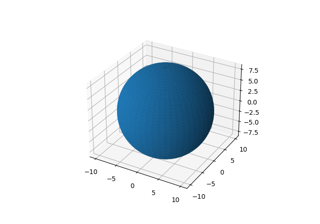
'equal': same as
aspect=1, i.e. same scaling for x and y.float: The displayed size of 1 unit in y-data coordinates will be aspect times the displayed size of 1 unit in x-data coordinates; e.g. for
aspect=2a square in data coordinates will be rendered with a height of twice its width.
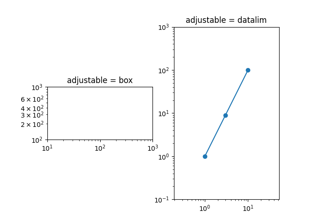
- adjustableNone or {'box', 'datalim'}, optional
If not
None, this defines which parameter will be adjusted to meet the required aspect. Seeset_adjustablefor further details.- anchorNone or str or (float, float), optional
If not
None, this defines where the Axes will be drawn if there is extra space due to aspect constraints. The most common way to to specify the anchor are abbreviations of cardinal directions:value
description
'C'
centered
'SW'
lower left corner
'S'
middle of bottom edge
'SE'
lower right corner
etc.
See
set_anchorfor further details.- sharebool, default: False
If
True, apply the settings to all shared Axes.
See also
matplotlib.axes.Axes.set_adjustableSet how the Axes adjusts to achieve the required aspect ratio.
matplotlib.axes.Axes.set_anchorSet the position in case of extra space.
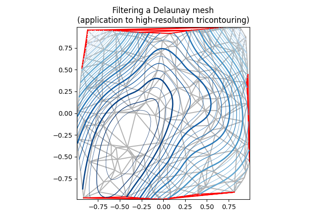
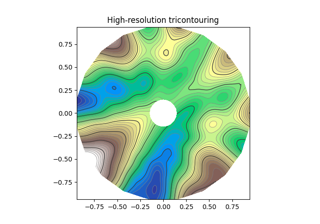
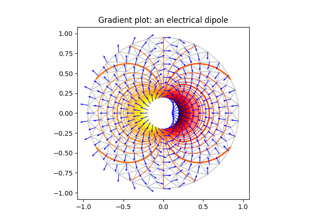
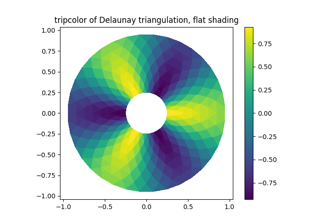
Examples using matplotlib.axes.Axes.set_aspect#
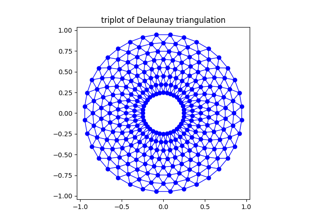
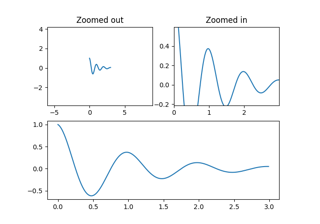
Controlling view limits using margins and sticky_edges