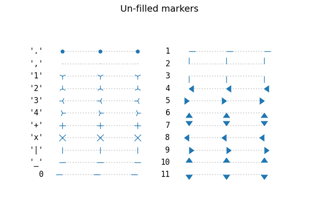
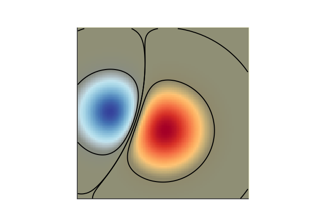
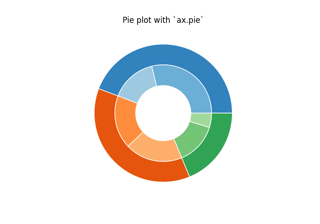
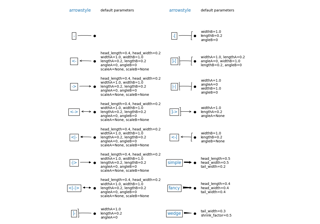
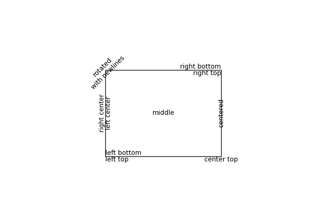
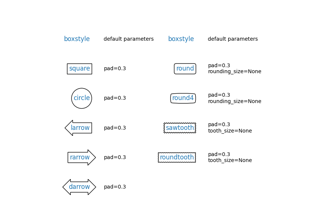
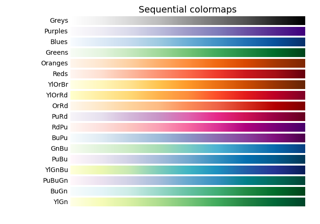
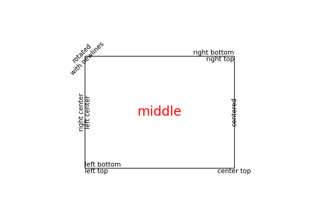
matplotlib.axes.Axes.set_axis_off# Axes.set_axis_off()[source]# Turn the x- and y-axis off. This affects the axis lines, ticks, ticklabels, grid and axis labels. Examples using matplotlib.axes.Axes.set_axis_off# Marker reference Marker reference Barcode Barcode Blend transparency with color in 2D images Blend transparency with color in 2D images Nested pie charts Nested pie charts Annotation arrow style reference Annotation arrow style reference Text alignment Text alignment Drawing fancy boxes Drawing fancy boxes Choosing Colormaps in Matplotlib Choosing Colormaps in Matplotlib Text properties and layout Text properties and layout