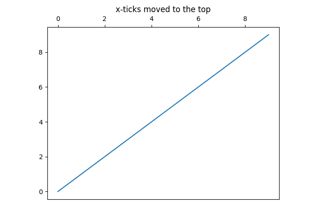
matplotlib.axes.Axes.tick_params#
- Axes.tick_params(axis='both', **kwargs)[source]#
Change the appearance of ticks, tick labels, and gridlines.
Tick properties that are not explicitly set using the keyword arguments remain unchanged unless reset is True.
- Parameters:
- axis{'x', 'y', 'both'}, default: 'both'
The axis to which the parameters are applied.
- which{'major', 'minor', 'both'}, default: 'major'
The group of ticks to which the parameters are applied.
- resetbool, default: False
Whether to reset the ticks to defaults before updating them.
- Other Parameters:
- direction{'in', 'out', 'inout'}
Puts ticks inside the Axes, outside the Axes, or both.
- lengthfloat
Tick length in points.
- widthfloat
Tick width in points.
- colorcolor
Tick color.
- padfloat
Distance in points between tick and label.
- labelsizefloat or str
Tick label font size in points or as a string (e.g., 'large').
- labelcolorcolor
Tick label color.
- colorscolor
Tick color and label color.
- zorderfloat
Tick and label zorder.
- bottom, top, left, rightbool
Whether to draw the respective ticks.
- labelbottom, labeltop, labelleft, labelrightbool
Whether to draw the respective tick labels.
- labelrotationfloat
Tick label rotation
- grid_colorcolor
Gridline color.
- grid_alphafloat
Transparency of gridlines: 0 (transparent) to 1 (opaque).
- grid_linewidthfloat
Width of gridlines in points.
- grid_linestylestr
Any valid
Line2Dline style spec.
Examples
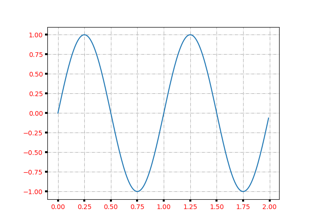
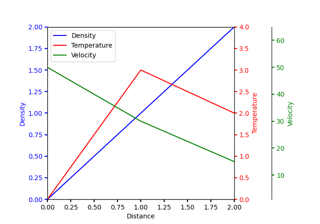
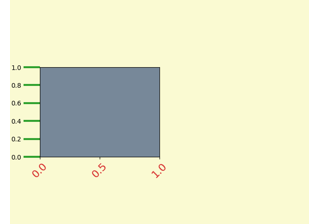
ax.tick_params(direction='out', length=6, width=2, colors='r',
               grid_color='r', grid_alpha=0.5)
This will make all major ticks be red, pointing out of the box, and with dimensions 6 points by 2 points. Tick labels will also be red. Gridlines will be red and translucent.