matplotlib.gridspec.GridSpecBase#
- class matplotlib.gridspec.GridSpecBase(nrows, ncols, height_ratios=None, width_ratios=None)[source]#
Bases:
objectA base class of GridSpec that specifies the geometry of the grid that a subplot will be placed.
- Parameters:
- nrows, ncolsint
The number of rows and columns of the grid.
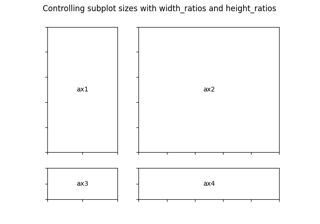
- width_ratiosarray-like of length ncols, optional
Defines the relative widths of the columns. Each column gets a relative width of
width_ratios[i] / sum(width_ratios). If not given, all columns will have the same width.- height_ratiosarray-like of length nrows, optional
Defines the relative heights of the rows. Each row gets a relative height of
height_ratios[i] / sum(height_ratios). If not given, all rows will have the same height.
- get_grid_positions(fig, raw=<deprecated parameter>)[source]#
Return the positions of the grid cells in figure coordinates.
- Parameters:
- fig
Figure The figure the grid should be applied to. The subplot parameters (margins and spacing between subplots) are taken from fig.
- rawbool, default: False
If True, the subplot parameters of the figure are not taken into account. The grid spans the range [0, 1] in both directions without margins and there is no space between grid cells. This is used for constrained_layout.
- fig
- Returns:
- bottoms, tops, lefts, rightsarray
The bottom, top, left, right positions of the grid cells in figure coordinates.
- get_height_ratios()[source]#
Return the height ratios.
This is None if no height ratios have been set explicitly.
- get_width_ratios()[source]#
Return the width ratios.
This is None if no width ratios have been set explicitly.
- property ncols#
The number of columns in the grid.
- new_subplotspec(loc, rowspan=1, colspan=1)[source]#
Create and return a
SubplotSpecinstance.- Parameters:
- loc(int, int)
The position of the subplot in the grid as
(row_index, column_index).- rowspan, colspanint, default: 1
The number of rows and columns the subplot should span in the grid.
- property nrows#
The number of rows in the grid.
- set_height_ratios(height_ratios)[source]#
Set the relative heights of the rows.
height_ratios must be of length nrows. Each row gets a relative height of
height_ratios[i] / sum(height_ratios).
- set_width_ratios(width_ratios)[source]#
Set the relative widths of the columns.
width_ratios must be of length ncols. Each column gets a relative width of
width_ratios[i] / sum(width_ratios).
- subplots(*, sharex=False, sharey=False, squeeze=True, subplot_kw=None)[source]#
Add all subplots specified by this
GridSpecto its parent figure.See
Figure.subplotsfor detailed documentation.
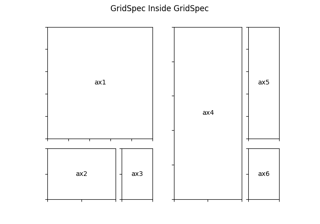
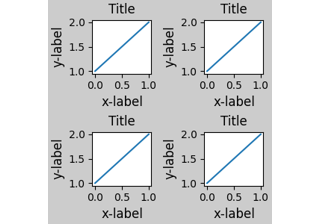
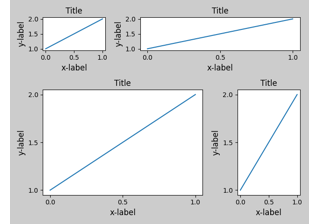
Examples using matplotlib.gridspec.GridSpecBase#
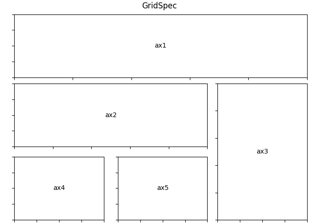
Using Gridspec to make multi-column/row subplot layouts