Note
Click here to download the full example code
TickedStroke patheffect
Matplotlib's patheffects can be used to alter the way paths
are drawn at a low enough level that they can affect almost anything.
The patheffects guide details the use of patheffects.
The TickedStroke patheffect illustrated here
draws a path with a ticked style. The spacing, length, and angle of
ticks can be controlled.
See also the contour demo example.
See also the contours in optimization example.
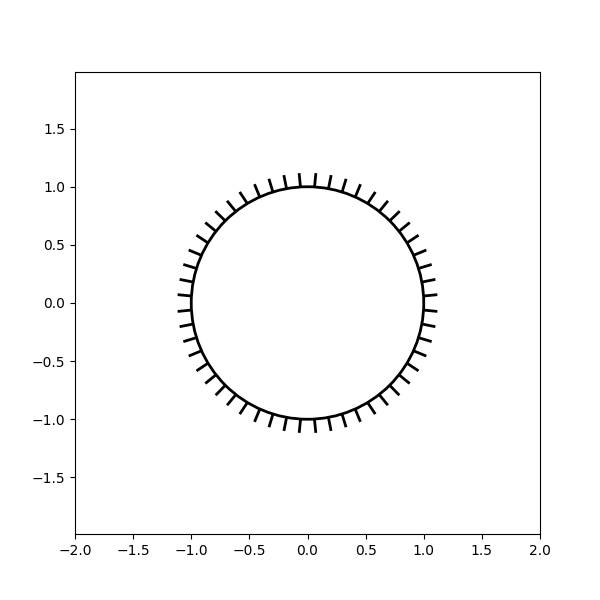
Applying TickedStroke to paths
import matplotlib.patches as patches
from matplotlib.path import Path
import numpy as np
import matplotlib.pyplot as plt
import matplotlib.patheffects as patheffects

fig, ax = plt.subplots(figsize=(6, 6))
path = Path.unit_circle()
patch = patches.PathPatch(path, facecolor='none', lw=2, path_effects=[
    patheffects.withTickedStroke(angle=-90, spacing=10, length=1)])

ax.add_patch(patch)
ax.axis('equal')
ax.set_xlim(-2, 2)
ax.set_ylim(-2, 2)

plt.show()
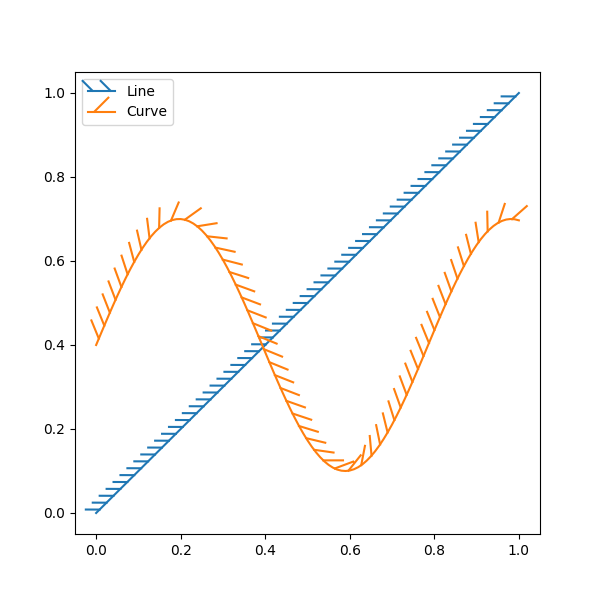
Applying TickedStroke to lines
fig, ax = plt.subplots(figsize=(6, 6))
ax.plot([0, 1], [0, 1], label="Line",
        path_effects=[patheffects.withTickedStroke(spacing=7, angle=135)])

nx = 101
x = np.linspace(0.0, 1.0, nx)
y = 0.3*np.sin(x*8) + 0.4
ax.plot(x, y, label="Curve", path_effects=[patheffects.withTickedStroke()])

ax.legend()

plt.show()
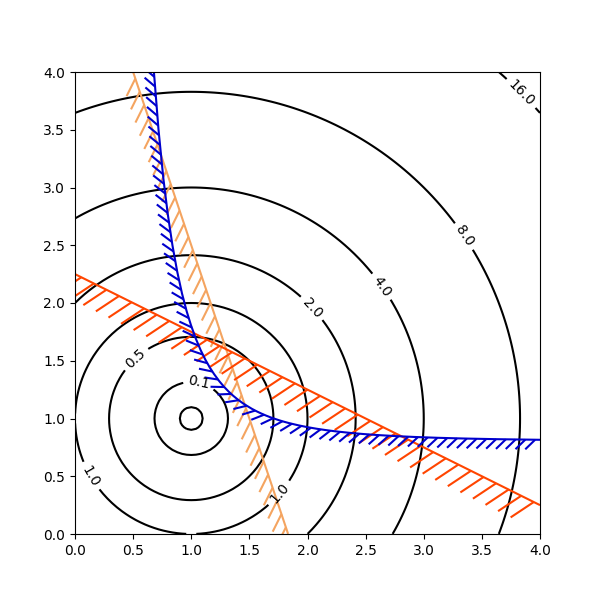
Applying TickedStroke to contour plots
Contour plot with objective and constraints. Curves generated by contour to represent a typical constraint in an optimization problem should be plotted with angles between zero and 180 degrees.
fig, ax = plt.subplots(figsize=(6, 6))

nx = 101
ny = 105

# Set up survey vectors
xvec = np.linspace(0.001, 4.0, nx)
yvec = np.linspace(0.001, 4.0, ny)

# Set up survey matrices.  Design disk loading and gear ratio.
x1, x2 = np.meshgrid(xvec, yvec)

# Evaluate some stuff to plot
obj = x1**2 + x2**2 - 2*x1 - 2*x2 + 2
g1 = -(3*x1 + x2 - 5.5)
g2 = -(x1 + 2*x2 - 4.5)
g3 = 0.8 + x1**-3 - x2

cntr = ax.contour(x1, x2, obj, [0.01, 0.1, 0.5, 1, 2, 4, 8, 16],
                  colors='black')
ax.clabel(cntr, fmt="%2.1f", use_clabeltext=True)

cg1 = ax.contour(x1, x2, g1, [0], colors='sandybrown')
plt.setp(cg1.collections,
         path_effects=[patheffects.withTickedStroke(angle=135)])

cg2 = ax.contour(x1, x2, g2, [0], colors='orangered')
plt.setp(cg2.collections,
         path_effects=[patheffects.withTickedStroke(angle=60, length=2)])

cg3 = ax.contour(x1, x2, g3, [0], colors='mediumblue')
plt.setp(cg3.collections,
         path_effects=[patheffects.withTickedStroke(spacing=7)])

ax.set_xlim(0, 4)
ax.set_ylim(0, 4)

plt.show()
Total running time of the script: ( 0 minutes 1.492 seconds)
Keywords: matplotlib code example, codex, python plot, pyplot Gallery generated by Sphinx-Gallery