Note
Click here to download the full example code
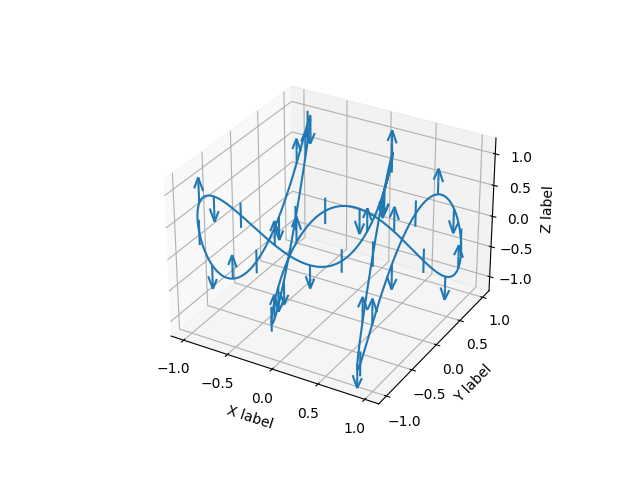
3D errorbars
An example of using errorbars with upper and lower limits in mplot3d.
import matplotlib.pyplot as plt
import numpy as np

ax = plt.figure().add_subplot(projection='3d')

# setting up a parametric curve
t = np.arange(0, 2*np.pi+.1, 0.01)
x, y, z = np.sin(t), np.cos(3*t), np.sin(5*t)

estep = 15
i = np.arange(t.size)
zuplims = (i % estep == 0) & (i // estep % 3 == 0)
zlolims = (i % estep == 0) & (i // estep % 3 == 2)

ax.errorbar(x, y, z, 0.2, zuplims=zuplims, zlolims=zlolims, errorevery=estep)

ax.set_xlabel("X label")
ax.set_ylabel("Y label")
ax.set_zlabel("Z label")

plt.show()
Keywords: matplotlib code example, codex, python plot, pyplot Gallery generated by Sphinx-Gallery