Note
Click here to download the full example code
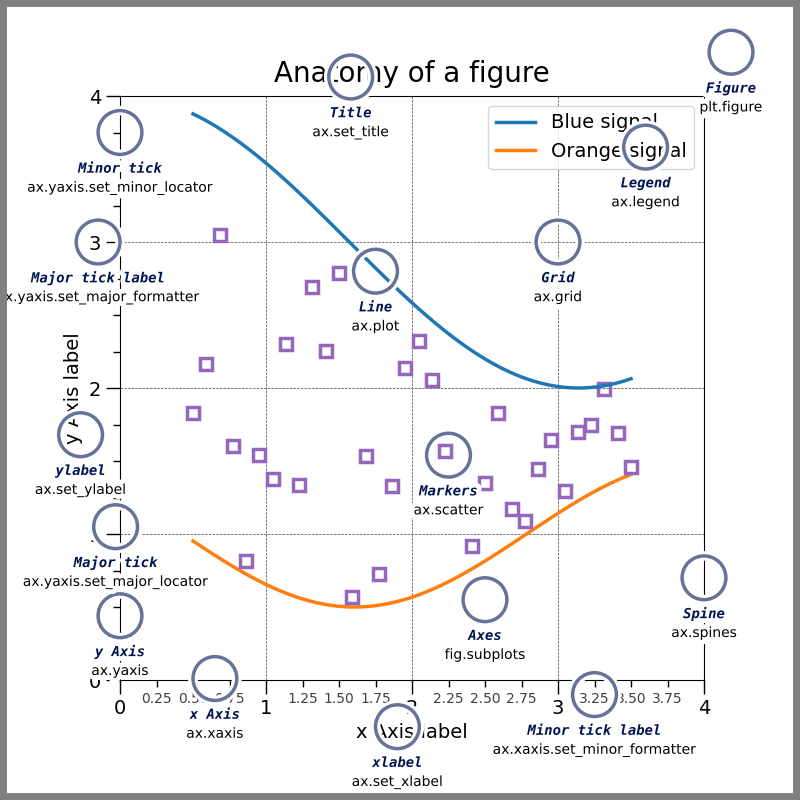
Anatomy of a figure
This figure shows the name of several matplotlib elements composing a figure
import numpy as np
import matplotlib.pyplot as plt
from matplotlib.patches import Circle, Rectangle
from matplotlib.patheffects import withStroke
from matplotlib.ticker import AutoMinorLocator, MultipleLocator

royal_blue = "#002082"
royal_blue = [0, 20/256, 82/256]

# make the figure

np.random.seed(19680801)

X = np.linspace(0.5, 3.5, 100)
Y1 = 3+np.cos(X)
Y2 = 1+np.cos(1+X/0.75)/2
Y3 = np.random.uniform(Y1, Y2, len(X))

fig = plt.figure(figsize=(8, 8), facecolor='1')
marg = 0.15
ax = fig.add_axes([marg, marg, 1-1.8*marg, 1-1.8*marg], aspect=1,
                  facecolor='1')


def minor_tick(x, pos):
    if not x % 1.0:
        return ""
    return f"{x:.2f}"

ax.xaxis.set_major_locator(MultipleLocator(1.000))
ax.xaxis.set_minor_locator(AutoMinorLocator(4))
ax.yaxis.set_major_locator(MultipleLocator(1.000))
ax.yaxis.set_minor_locator(AutoMinorLocator(4))
# FuncFormatter is created and used automatically
ax.xaxis.set_minor_formatter(minor_tick)

ax.set_xlim(0, 4)
ax.set_ylim(0, 4)

ax.tick_params(which='major', width=1.0, labelsize=14)
ax.tick_params(which='major', length=10, labelsize=14)
ax.tick_params(which='minor', width=1.0, labelsize=10)
ax.tick_params(which='minor', length=5, labelsize=10, labelcolor='0.25')

ax.grid(linestyle="--", linewidth=0.5, color='.25', zorder=-10)

ax.plot(X, Y1, c='C0', lw=2.5, label="Blue signal", zorder=10)
ax.plot(X, Y2, c='C1', lw=2.5, label="Orange signal")
ax.plot(X[::3], Y3[::3], linewidth=0, markersize=9,
        marker='s', markerfacecolor='none', markeredgecolor='C4',
        markeredgewidth=2.5)

ax.set_title("Anatomy of a figure", fontsize=20, verticalalignment='bottom')
ax.set_xlabel("x Axis label", fontsize=14)
ax.set_ylabel("y Axis label", fontsize=14)

ax.legend(loc="upper right", fontsize=14)

# Annotate the figure


def just_circle(x, y, radius=0.15):
    c = Circle((x, y), radius, clip_on=False, zorder=10, linewidth=2.5,
               edgecolor=royal_blue + [0.6], facecolor='none',
               path_effects=[withStroke(linewidth=7, foreground=(1, 1, 1, 1))])
    ax.add_artist(c)


def text(x, y, text):
    ax.text(x, y, text, zorder=100,
            ha='center', va='top', weight='bold', color=royal_blue,
            style='italic', fontfamily='monospace',
            path_effects=[withStroke(linewidth=7, foreground=(1, 1, 1, 1))])


def code(x, y, text):
    ax.text(x, y, text, zorder=100,
            ha='center', va='top', weight='normal', color='0.0',
            fontfamily='Courier New', fontsize='medium',
            path_effects=[withStroke(linewidth=7, foreground=(1, 1, 1, 1))])


def circle(x, y, txt, cde, radius=0.15):
    just_circle(x, y, radius=radius)
    text(x, y-0.2, txt)
    code(x, y-0.33, cde)

# Minor tick label
circle(3.25, -0.10, "Minor tick label",
       "ax.xaxis.set_minor_formatter")

# Major tick
circle(-0.03, 1.05, "Major tick", "ax.yaxis.set_major_locator")

# Minor tick
y = 3.75
circle(0.00, 3.75, "Minor tick", "ax.yaxis.set_minor_locator")

# Major tick label
circle(-0.15, 3.00, "Major tick label", "ax.yaxis.set_major_formatter")

# X Label
circle(1.90, -0.32, "xlabel", "ax.set_xlabel")

# Y Label
circle(-0.27, 1.68, "ylabel", "ax.set_ylabel")

# Title
circle(1.58, 4.13, "Title", "ax.set_title")

# Blue plot
circle(1.75, 2.80, "Line", "ax.plot")

# Scatter plot
circle(2.25, 1.54, "Markers", "ax.scatter")

# Grid
circle(3.00, 3.00, "Grid", "ax.grid")

# Legend
circle(3.60, 3.65, "Legend", "ax.legend")

# Axes
circle(2.5, 0.55, "Axes", "fig.subplots")

# Figure
circle(4.185, 4.3, "Figure", "plt.figure")

# x Axis
circle(0.65, 0.01, "x Axis", "ax.xaxis")

# y Axis
circle(0, 0.44, "y Axis", "ax.yaxis")

# Spine
circle(4.0, 0.7, "Spine", "ax.spines")

# frame around figure...
fig.add_artist(Rectangle((0, 0), width=1, height=1, facecolor='none',
               edgecolor='0.5', linewidth=10))

plt.show()
References
The use of the following functions, methods, classes and modules is shown in this example:
Total running time of the script: ( 0 minutes 1.187 seconds)
Keywords: matplotlib code example, codex, python plot, pyplot Gallery generated by Sphinx-Gallery