Note
Click here to download the full example code
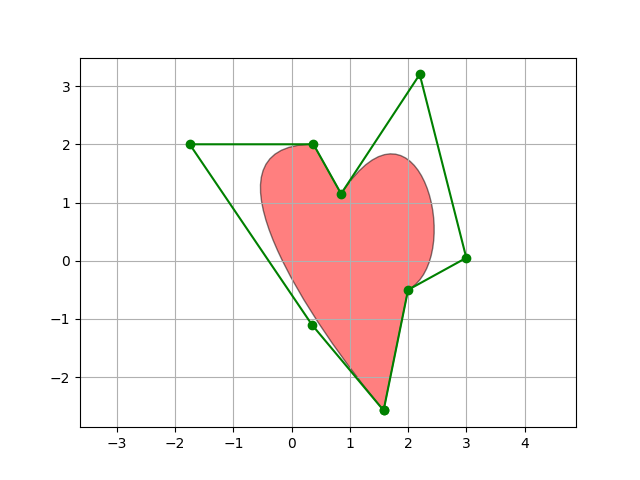
PathPatch object
This example shows how to create Path and PathPatch
objects through Matplotlib's API.
import matplotlib.path as mpath
import matplotlib.patches as mpatches
import matplotlib.pyplot as plt

fig, ax = plt.subplots()

Path = mpath.Path
path_data = [
    (Path.MOVETO, (1.58, -2.57)),
    (Path.CURVE4, (0.35, -1.1)),
    (Path.CURVE4, (-1.75, 2.0)),
    (Path.CURVE4, (0.375, 2.0)),
    (Path.LINETO, (0.85, 1.15)),
    (Path.CURVE4, (2.2, 3.2)),
    (Path.CURVE4, (3, 0.05)),
    (Path.CURVE4, (2.0, -0.5)),
    (Path.CLOSEPOLY, (1.58, -2.57)),
    ]
codes, verts = zip(*path_data)
path = mpath.Path(verts, codes)
patch = mpatches.PathPatch(path, facecolor='r', alpha=0.5)
ax.add_patch(patch)

# plot control points and connecting lines
x, y = zip(*path.vertices)
line, = ax.plot(x, y, 'go-')

ax.grid()
ax.axis('equal')
plt.show()
References
The use of the following functions, methods, classes and modules is shown in this example:
Keywords: matplotlib code example, codex, python plot, pyplot Gallery generated by Sphinx-Gallery