matplotlib.axes.Axes.triplot#
- Axes.triplot(*args, **kwargs)[source]#
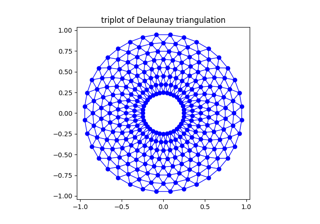
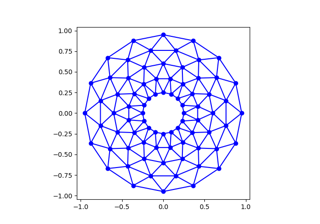
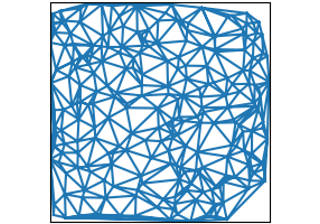
Draw a unstructured triangular grid as lines and/or markers.
The triangulation to plot can be specified in one of two ways; either:
triplot(triangulation, ...)
where triangulation is a
Triangulationobject, ortriplot(x, y, ...) triplot(x, y, triangles, ...) triplot(x, y, triangles=triangles, ...) triplot(x, y, mask=mask, ...) triplot(x, y, triangles, mask=mask, ...)
in which case a Triangulation object will be created. See
Triangulationfor a explanation of these possibilities.The remaining args and kwargs are the same as for
plot.