matplotlib.axes.Axes.quiver#
- Axes.quiver(*args, data=None, **kwargs)[source]#
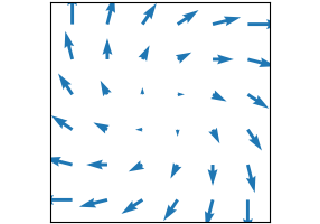
Plot a 2D field of arrows.
Call signature:
quiver([X, Y], U, V, [C], **kw)
X, Y define the arrow locations, U, V define the arrow directions, and C optionally sets the color.
Each arrow is internally represented by a filled polygon with a default edge linewidth of 0. As a result, an arrow is rather a filled area, not a line with a head, and
PolyCollectionproperties like linewidth, linestyle, facecolor, etc. act accordingly.Arrow size
The default settings auto-scales the length of the arrows to a reasonable size. To change this behavior see the scale and scale_units parameters.
Arrow shape
The defaults give a slightly swept-back arrow; to make the head a triangle, make headaxislength the same as headlength. To make the arrow more pointed, reduce headwidth or increase headlength and headaxislength. To make the head smaller relative to the shaft, scale down all the head parameters. You will probably do best to leave minshaft alone.
Arrow outline
linewidths and edgecolors can be used to customize the arrow outlines.
- Parameters
- X, Y1D or 2D array-like, optional
The x and y coordinates of the arrow locations.
If not given, they will be generated as a uniform integer meshgrid based on the dimensions of U and V.
If X and Y are 1D but U, V are 2D, X, Y are expanded to 2D using
X, Y = np.meshgrid(X, Y). In this caselen(X)andlen(Y)must match the column and row dimensions of U and V.- U, V1D or 2D array-like
The x and y direction components of the arrow vectors.
They must have the same number of elements, matching the number of arrow locations. U and V may be masked. Only locations unmasked in U, V, and C will be drawn.
- C1D or 2D array-like, optional
Numeric data that defines the arrow colors by colormapping via norm and cmap.
This does not support explicit colors. If you want to set colors directly, use color instead. The size of C must match the number of arrow locations.
- units{'width', 'height', 'dots', 'inches', 'x', 'y', 'xy'}, default: 'width'
The arrow dimensions (except for length) are measured in multiples of this unit.
The following values are supported:
'width', 'height': The width or height of the axis.
'dots', 'inches': Pixels or inches based on the figure dpi.
'x', 'y', 'xy': X, Y or \(\sqrt{X^2 + Y^2}\) in data units.
The arrows scale differently depending on the units. For 'x' or 'y', the arrows get larger as one zooms in; for other units, the arrow size is independent of the zoom state. For 'width or 'height', the arrow size increases with the width and height of the axes, respectively, when the window is resized; for 'dots' or 'inches', resizing does not change the arrows.
- angles{'uv', 'xy'} or array-like, default: 'uv'
Method for determining the angle of the arrows.
'uv': The arrow axis aspect ratio is 1 so that if U == V the orientation of the arrow on the plot is 45 degrees counter-clockwise from the horizontal axis (positive to the right).
Use this if the arrows symbolize a quantity that is not based on X, Y data coordinates.
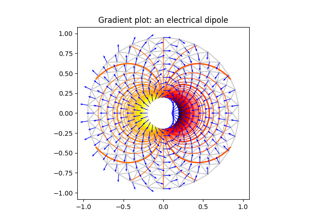
'xy': Arrows point from (x, y) to (x+u, y+v). Use this for plotting a gradient field, for example.
Alternatively, arbitrary angles may be specified explicitly as an array of values in degrees, counter-clockwise from the horizontal axis.
In this case U, V is only used to determine the length of the arrows.
Note: inverting a data axis will correspondingly invert the arrows only with
angles='xy'.- scalefloat, optional
Number of data units per arrow length unit, e.g., m/s per plot width; a smaller scale parameter makes the arrow longer. Default is None.
If None, a simple autoscaling algorithm is used, based on the average vector length and the number of vectors. The arrow length unit is given by the scale_units parameter.
- scale_units{'width', 'height', 'dots', 'inches', 'x', 'y', 'xy'}, optional
If the scale kwarg is None, the arrow length unit. Default is None.
e.g. scale_units is 'inches', scale is 2.0, and
(u, v) = (1, 0), then the vector will be 0.5 inches long.If scale_units is 'width' or 'height', then the vector will be half the width/height of the axes.
If scale_units is 'x' then the vector will be 0.5 x-axis units. To plot vectors in the x-y plane, with u and v having the same units as x and y, use
angles='xy', scale_units='xy', scale=1.- widthfloat, optional
Shaft width in arrow units; default depends on choice of units, above, and number of vectors; a typical starting value is about 0.005 times the width of the plot.
- headwidthfloat, default: 3
Head width as multiple of shaft width.
- headlengthfloat, default: 5
Head length as multiple of shaft width.
- headaxislengthfloat, default: 4.5
Head length at shaft intersection.
- minshaftfloat, default: 1
Length below which arrow scales, in units of head length. Do not set this to less than 1, or small arrows will look terrible!
- minlengthfloat, default: 1
Minimum length as a multiple of shaft width; if an arrow length is less than this, plot a dot (hexagon) of this diameter instead.
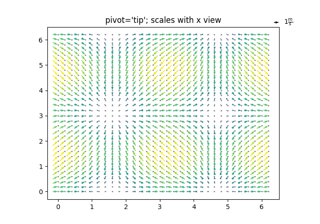
- pivot{'tail', 'mid', 'middle', 'tip'}, default: 'tail'
The part of the arrow that is anchored to the X, Y grid. The arrow rotates about this point.
'mid' is a synonym for 'middle'.
- colorcolor or color sequence, optional
Explicit color(s) for the arrows. If C has been set, color has no effect.
This is a synonym for the
PolyCollectionfacecolor parameter.
- Returns
- Other Parameters
- dataindexable object, optional
If given, all parameters also accept a string
s, which is interpreted asdata[s](unless this raises an exception).- **kwargs
PolyCollectionproperties, optional All other keyword arguments are passed on to
PolyCollection:Property
Description
a filter function, which takes a (m, n, 3) float array and a dpi value, and returns a (m, n, 3) array and two offsets from the bottom left corner of the image
array-like or scalar or None
bool
antialiasedor aa or antialiasedsbool or list of bools
array-like or None
CapStyleor {'butt', 'projecting', 'round'}(vmin: float, vmax: float)
bool
Patch or (Path, Transform) or None
Colormapor str or Nonecolor or list of rgba tuples
edgecoloror ec or edgecolorscolor or list of colors or 'face'
facecoloror facecolors or fccolor or list of colors
str
{'/', '\', '|', '-', '+', 'x', 'o', 'O', '.', '*'}
bool
JoinStyleor {'miter', 'round', 'bevel'}object
linestyleor dashes or linestyles or lsstr or tuple or list thereof
linewidthor linewidths or lwfloat or list of floats
Normalizeor None(N, 2) or (2,) array-like
list of array-like
None or bool or float or callable
float
bool
sizesndarray or None
(scale: float, length: float, randomness: float)
bool or None
str
list of str or None
list of array-like
unknown
bool
float
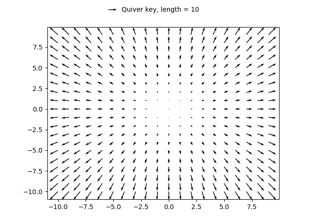
See also
Axes.quiverkeyAdd a key to a quiver plot.