matplotlib.axes.Axes.set_xticks#

Axes.set_xticks(ticks, labels=None, *, minor=False, **kwargs)[source]#

Set the xaxis' tick locations and optionally labels.

If necessary, the view limits of the Axis are expanded so that all given ticks are visible.

Parameters
tickslist of floats

List of tick locations.

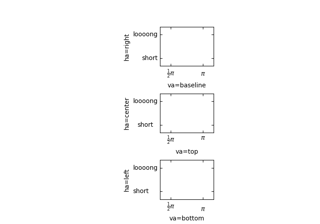
labelslist of str, optional

List of tick labels. If not set, the labels show the data value.

minorbool, default: False

If False, set the major ticks; if True, the minor ticks.

**kwargs

Text properties for the labels. These take effect only if you pass labels. In other cases, please use tick_params.

Notes

The mandatory expansion of the view limits is an intentional design choice to prevent the surprise of a non-visible tick. If you need other limits, you should set the limits explicitly after setting the ticks.

Examples using matplotlib.axes.Axes.set_xticks#

Bar Label Demo

Bar Label Demo

Bar Label Demo
Grouped bar chart with labels

Grouped bar chart with labels

Grouped bar chart with labels
Hat graph

Hat graph

Hat graph
Psd Demo

Psd Demo

Psd Demo
Creating annotated heatmaps

Creating annotated heatmaps

Creating annotated heatmaps
Box plot vs. violin plot comparison

Box plot vs. violin plot comparison

Box plot vs. violin plot comparison
Violin plot customization

Violin plot customization

Violin plot customization
Producing multiple histograms side by side

Producing multiple histograms side by side

Producing multiple histograms side by side
Multiline

Multiline

Multiline
Rendering math equations using TeX

Rendering math equations using TeX

Rendering math equations using TeX
ggplot style sheet

ggplot style sheet

ggplot style sheet
Scatter Histogram (Locatable Axes)

Scatter Histogram (Locatable Axes)

Scatter Histogram (Locatable Axes)
Simple Axisline4

Simple Axisline4

Simple Axisline4
Ticklabel alignment

Ticklabel alignment

Ticklabel alignment
Ticklabel direction

Ticklabel direction

Ticklabel direction
Bachelor's degrees by gender

Bachelor's degrees by gender

Bachelor's degrees by gender
Integral as the area under a curve

Integral as the area under a curve

Integral as the area under a curve
Shaded & power normalized rendering

Shaded & power normalized rendering

Shaded & power normalized rendering
XKCD

XKCD

XKCD
Rain simulation

Rain simulation

Rain simulation
MATPLOTLIB **UNCHAINED**

MATPLOTLIB UNCHAINED

MATPLOTLIB **UNCHAINED**
Frontpage 3D example

Frontpage 3D example

Frontpage 3D example
Frontpage contour example

Frontpage contour example

Frontpage contour example
Frontpage histogram example

Frontpage histogram example

Frontpage histogram example
Frontpage plot example

Frontpage plot example

Frontpage plot example
Log Bar

Log Bar

Log Bar
MRI With EEG

MRI With EEG

MRI With EEG
Custom spine bounds

Custom spine bounds

Custom spine bounds
Group barchart with units

Group barchart with units

Group barchart with units
The Lifecycle of a Plot

The Lifecycle of a Plot

The Lifecycle of a Plot