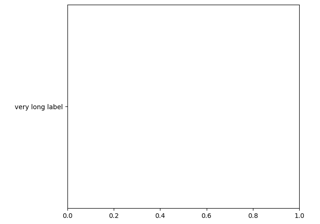
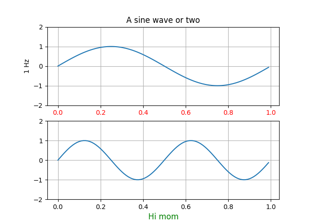
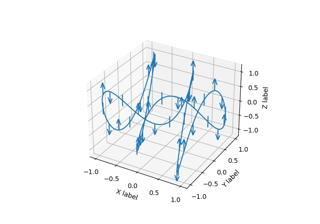
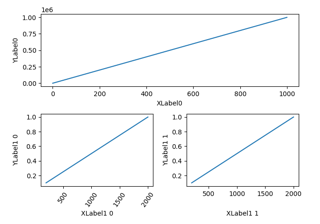
matplotlib.axes.Axes.set_xlabel#
- Axes.set_xlabel(xlabel, fontdict=None, labelpad=None, *, loc=None, **kwargs)[source]#
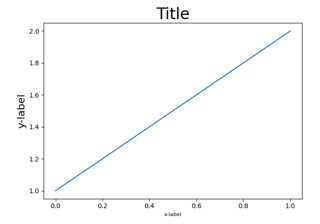
Set the label for the x-axis.
- Parameters
- xlabelstr
The label text.
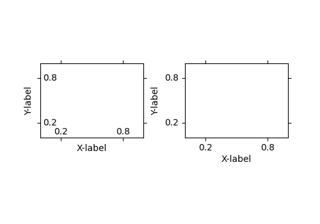
- labelpadfloat, default:
rcParams["axes.labelpad"](default:4.0) Spacing in points from the Axes bounding box including ticks and tick labels. If None, the previous value is left as is.
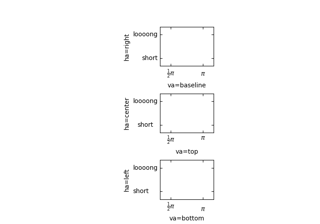
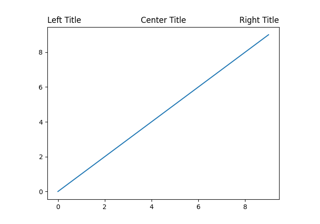
- loc{'left', 'center', 'right'}, default:
rcParams["xaxis.labellocation"](default:'center') The label position. This is a high-level alternative for passing parameters x and horizontalalignment.
- Other Parameters
Examples using matplotlib.axes.Axes.set_xlabel#
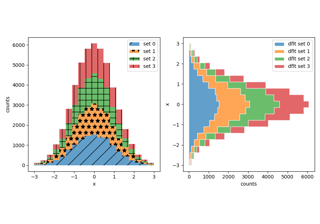
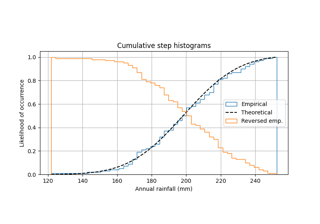
Using histograms to plot a cumulative distribution
Using histograms to plot a cumulative distribution

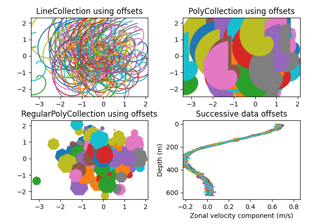
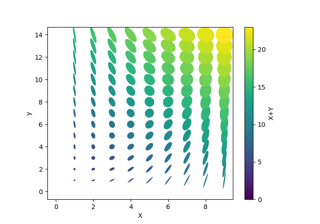
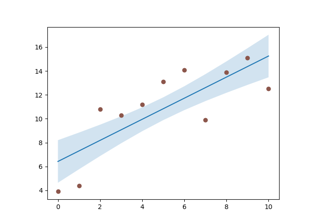
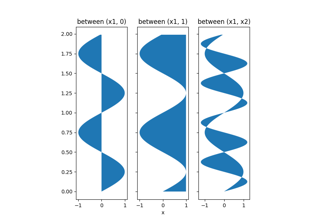
Line, Poly and RegularPoly Collection with autoscaling
Line, Poly and RegularPoly Collection with autoscaling