Examples#
This page contains example plots. Click on any image to see the full image and source code.
For longer tutorials, see our tutorials page. You can also find external resources and a FAQ in our user guide.
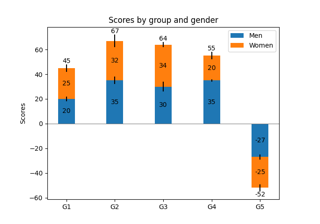
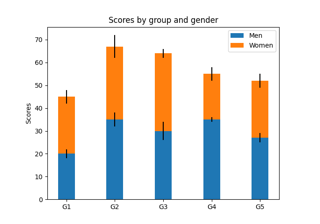
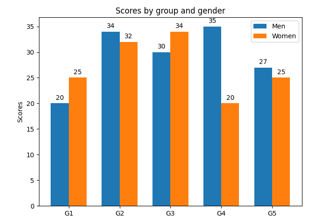
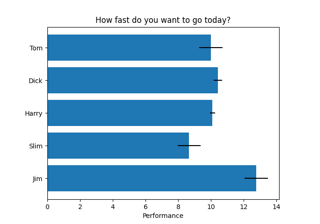
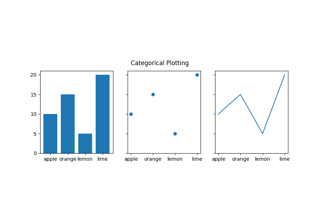
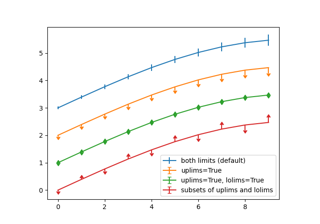
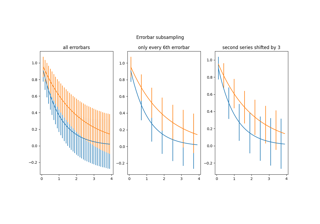
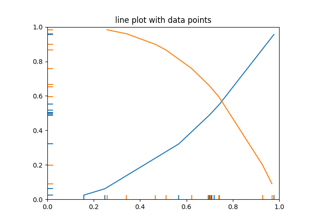
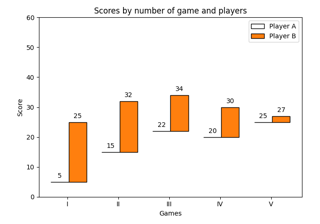
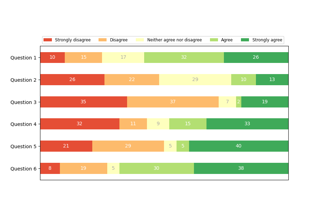
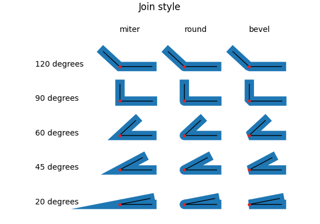
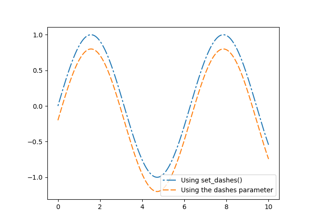
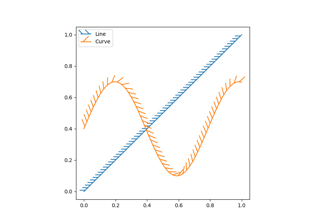
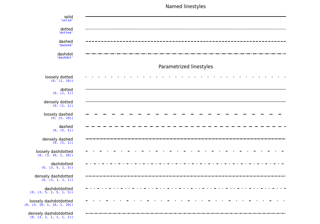
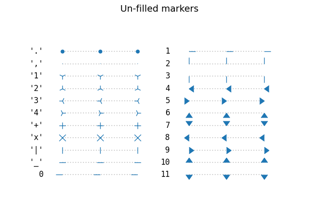
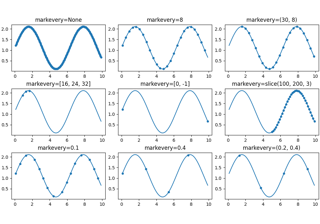
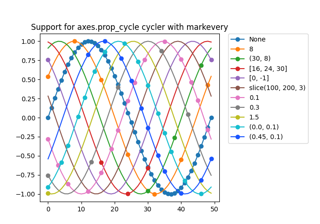
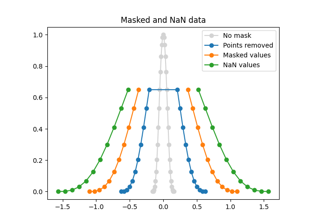
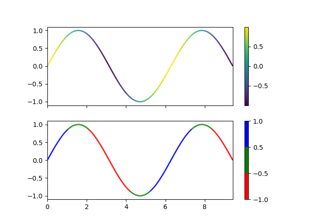
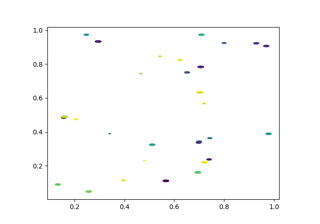
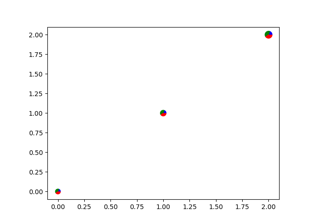
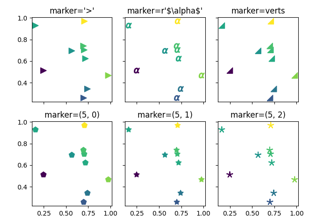
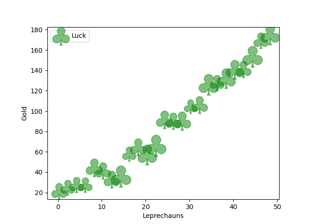
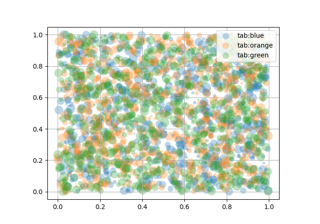
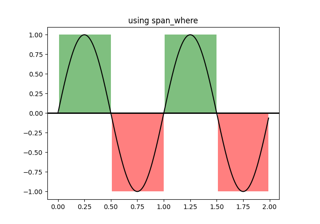
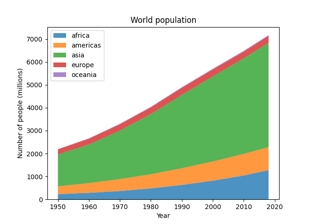
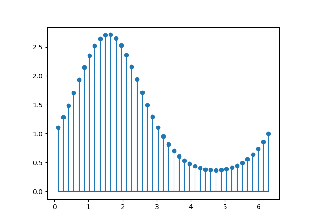
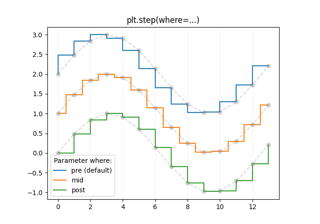
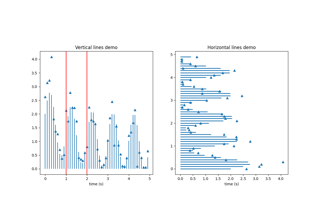
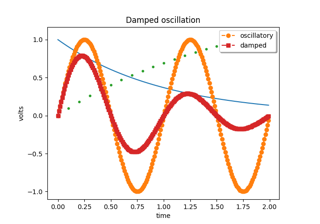
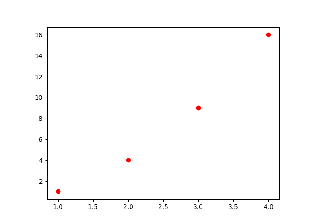
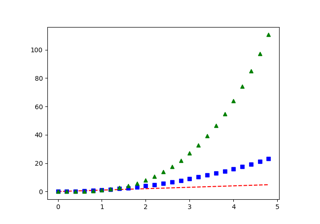
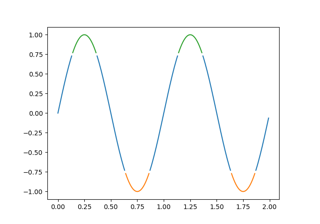
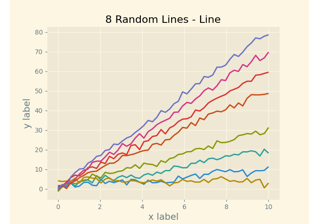
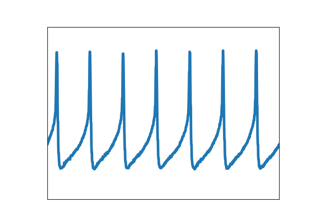
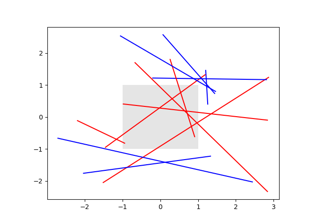
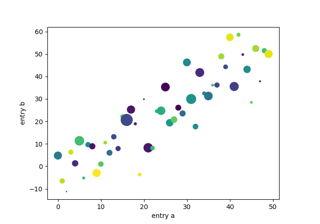
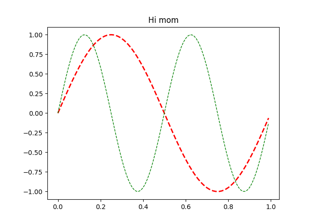
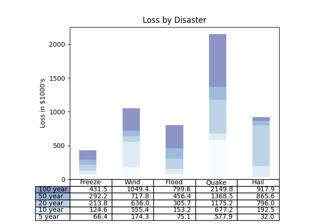
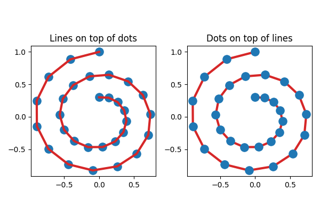
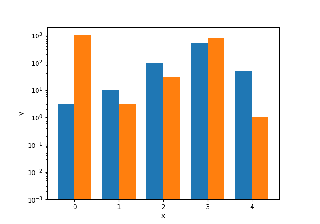
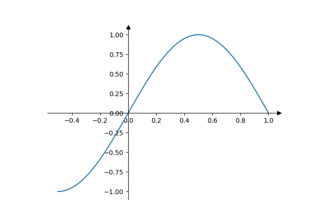
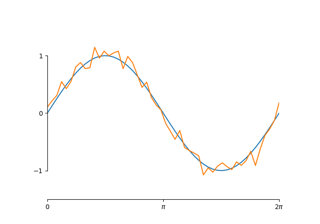
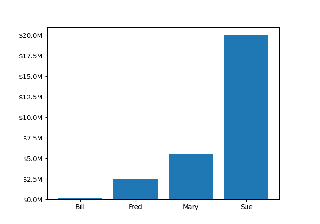
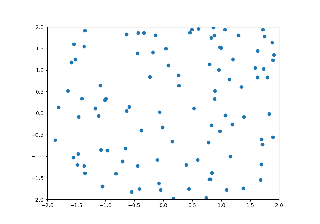
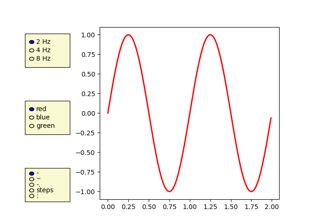
Lines, bars and markers#
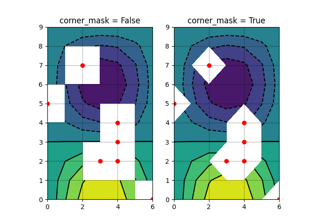
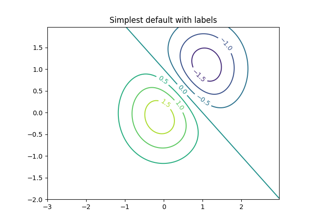
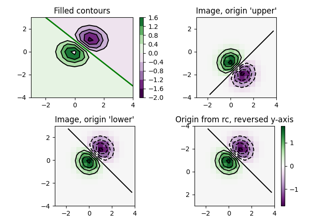
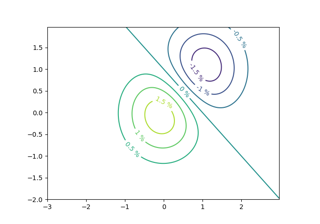
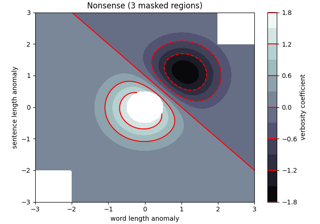
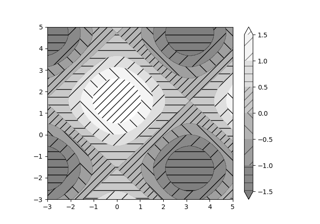
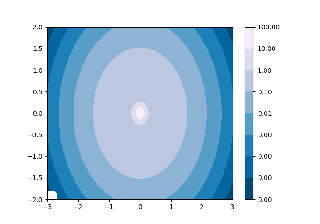
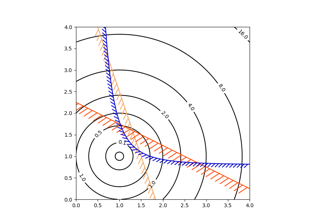
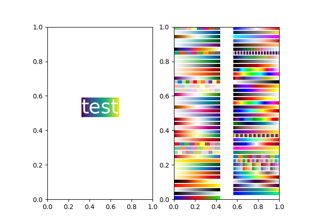
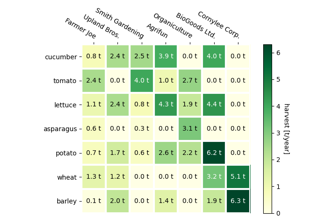
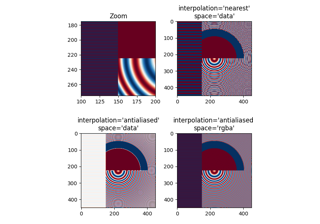
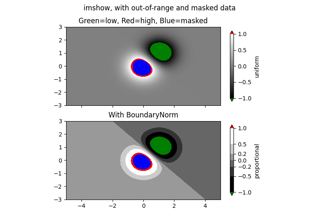
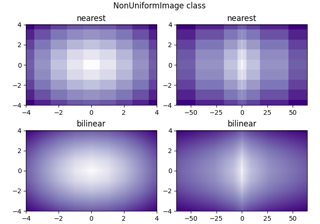
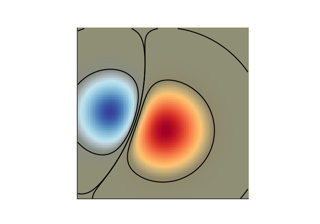
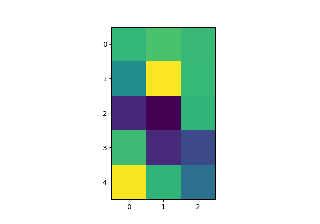
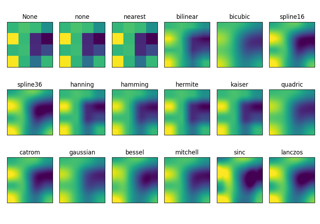
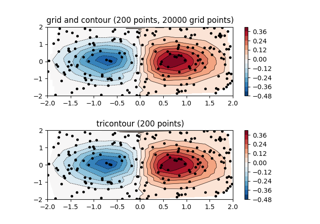
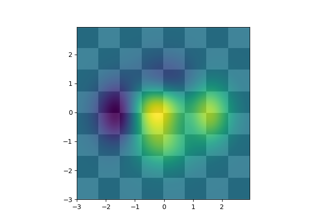
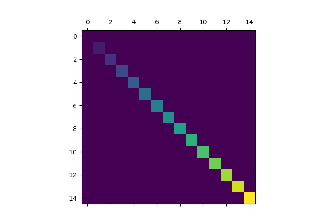
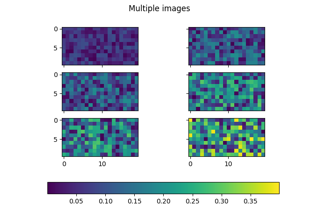
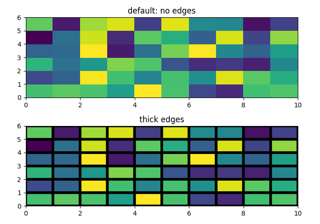
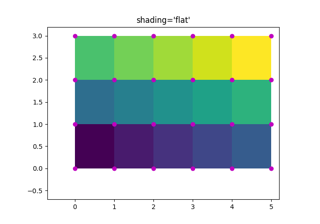
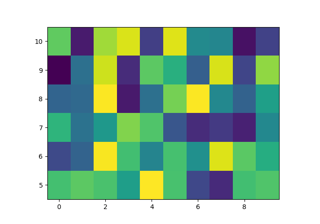
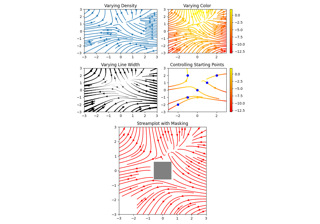
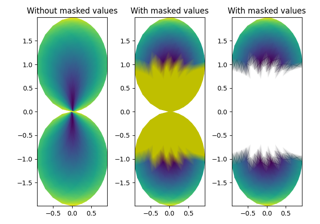
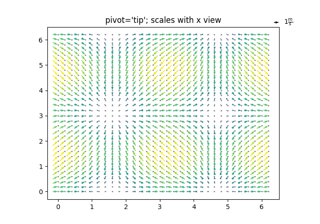
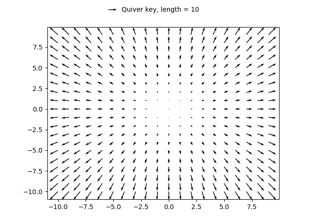
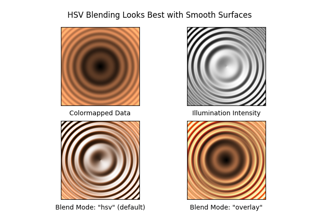
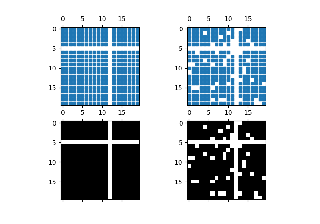
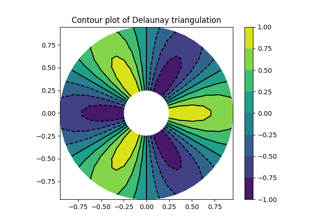
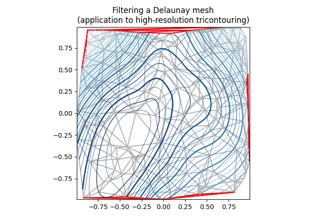
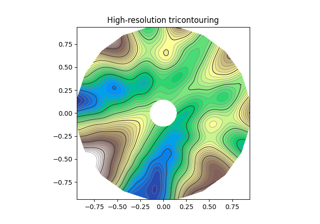
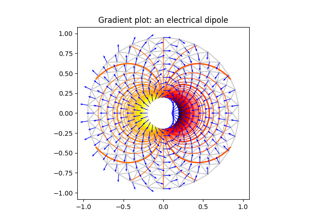
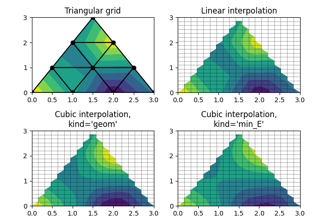
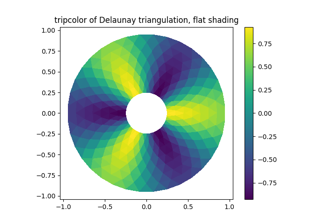
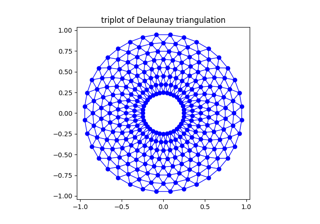
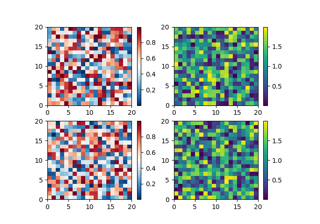
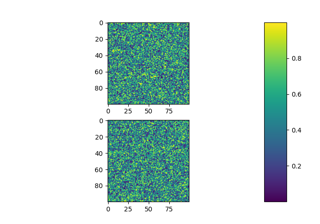
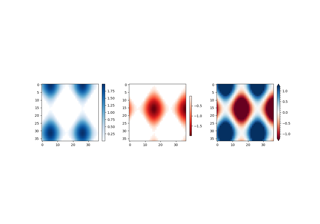
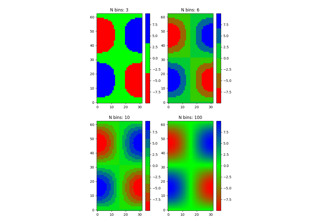
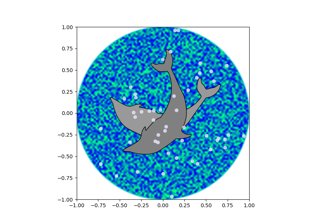
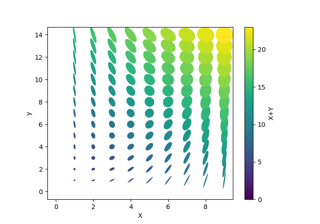
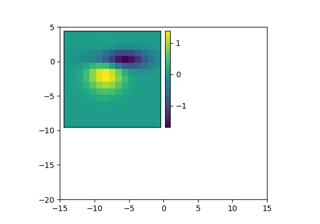
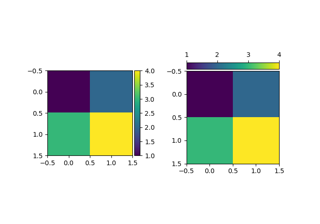
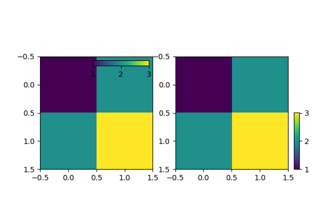
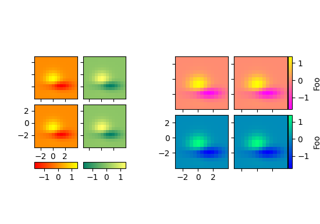
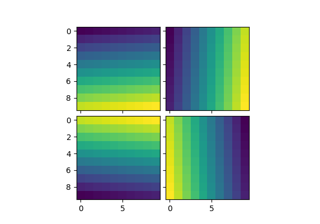
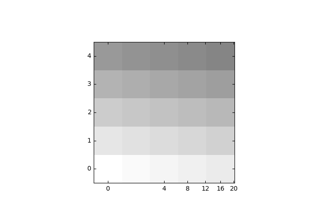
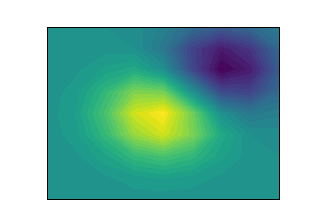
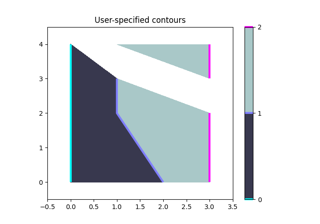
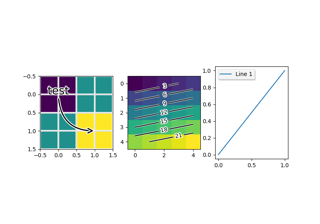
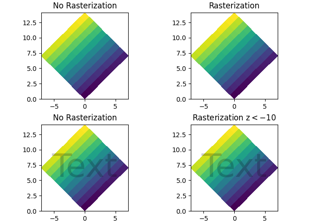
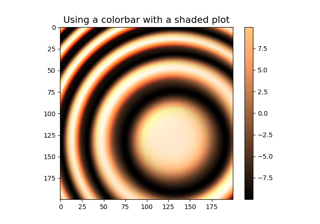
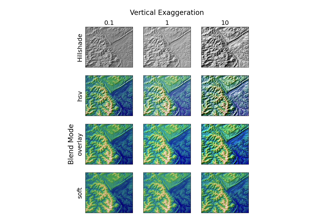
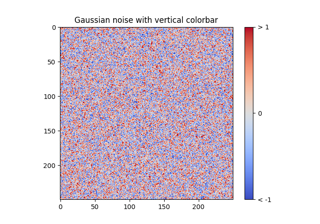
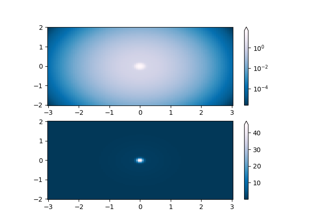
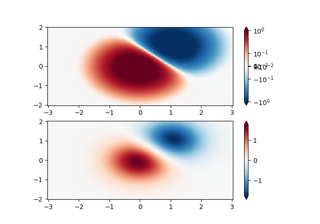
Images, contours and fields#


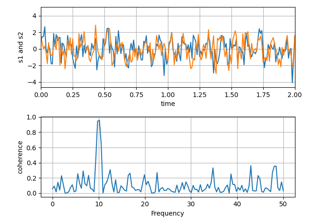
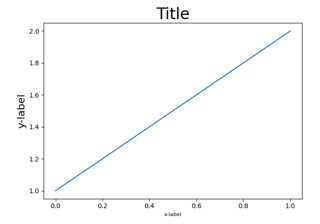
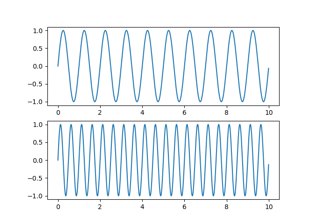
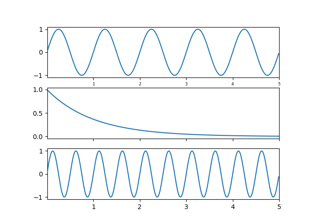
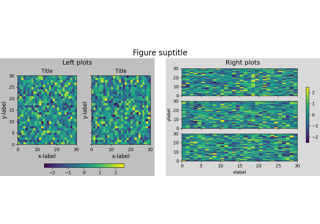
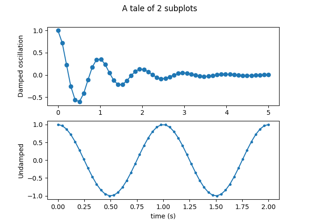
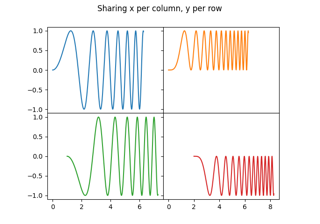
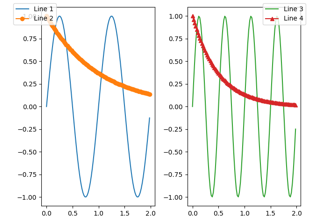
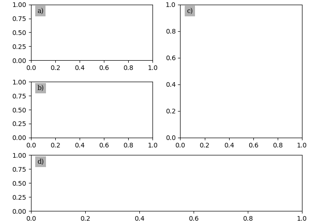
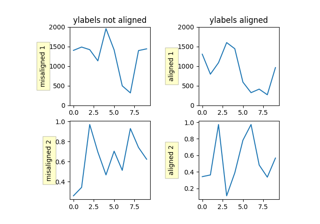
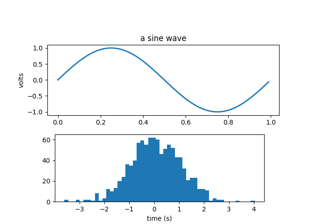
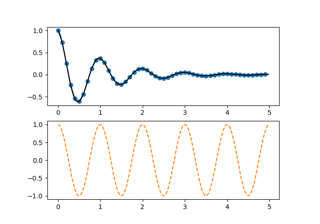
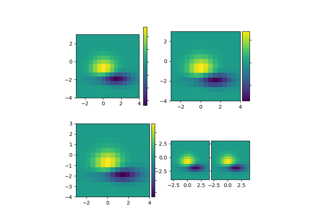
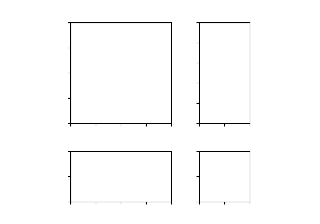
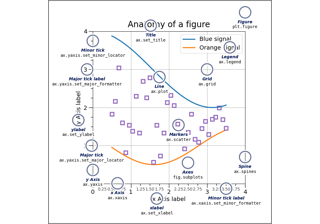
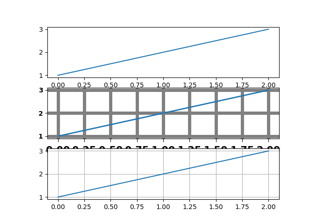
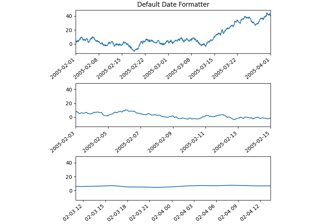
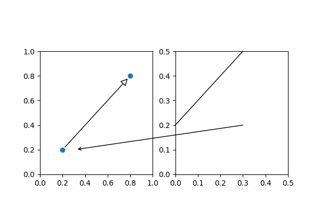
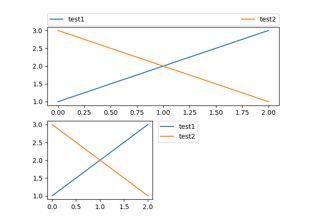
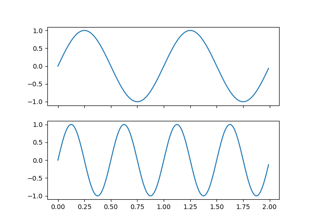
Subplots, axes and figures#
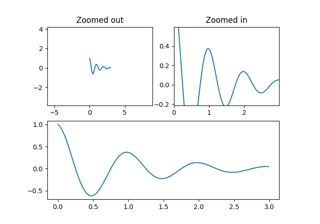
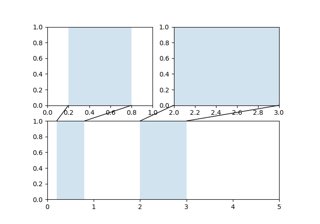
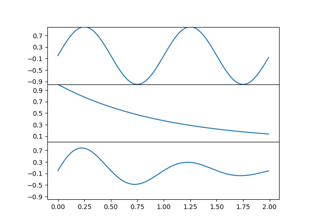
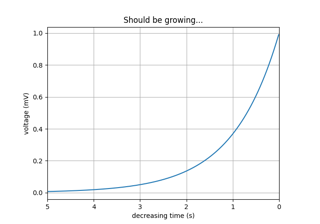
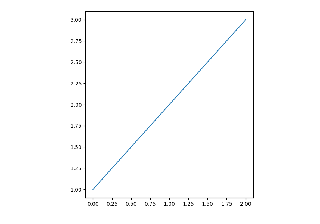
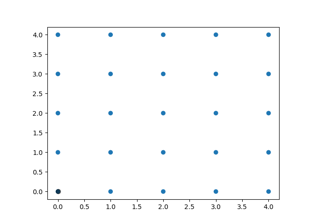
Controlling view limits using margins and sticky_edges
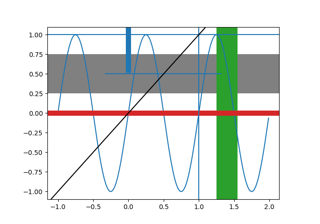
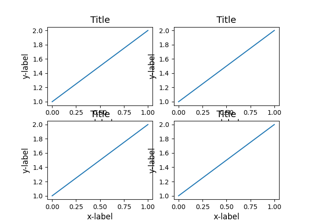
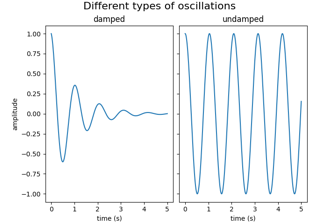
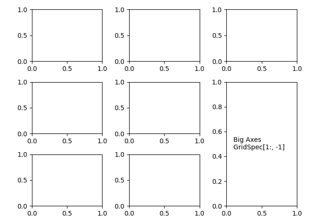
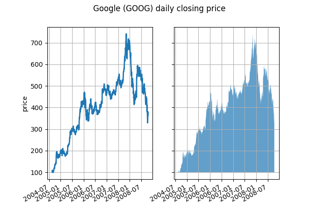
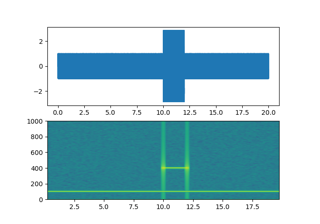
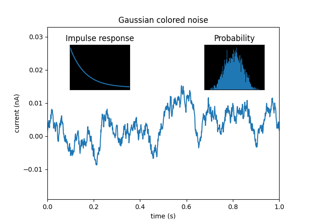
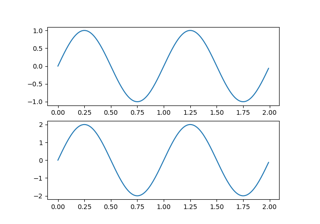
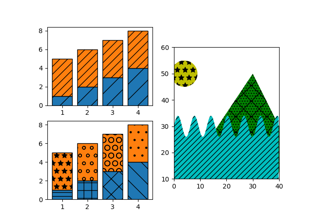
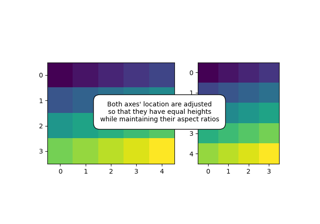
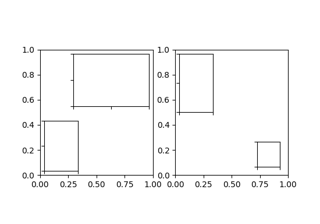
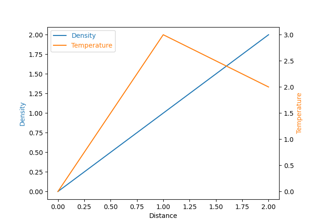
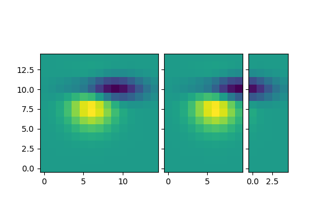
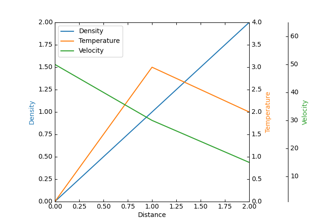
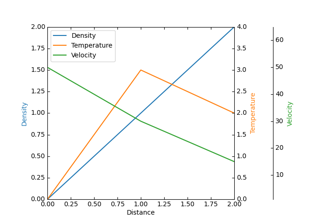
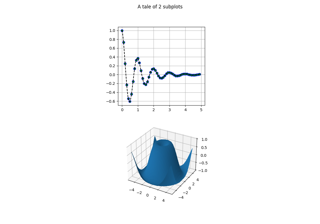
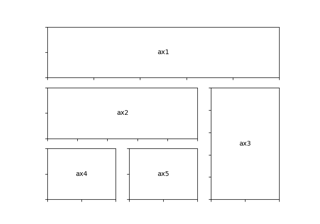
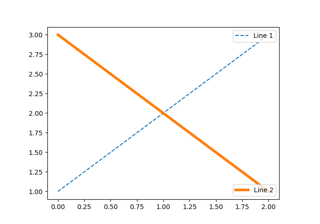
Combining two subplots using subplots and GridSpec
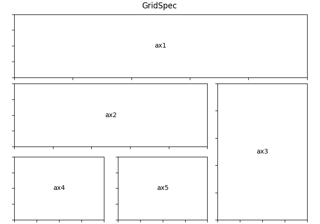
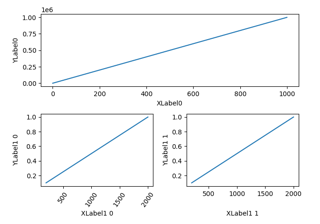
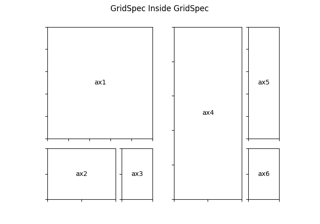
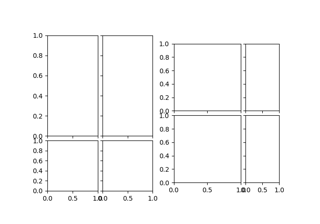
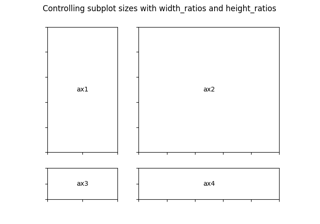
Using Gridspec to make multi-column/row subplot layouts
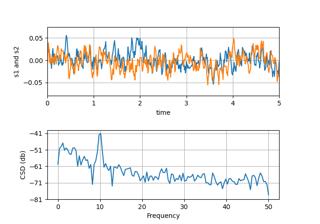
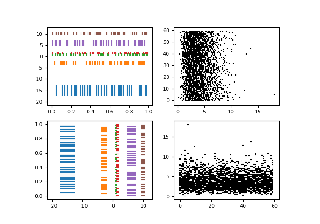
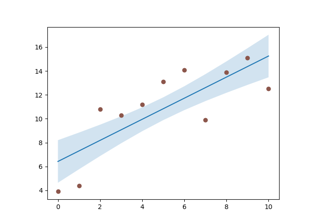
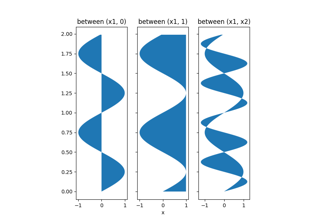
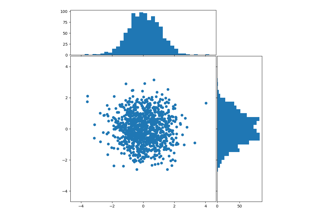
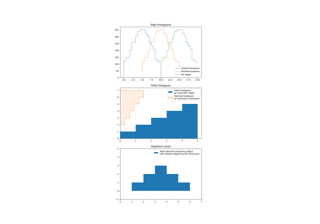
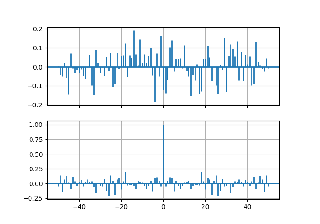
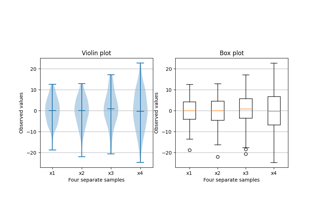
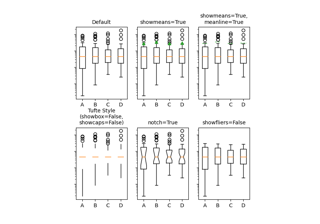
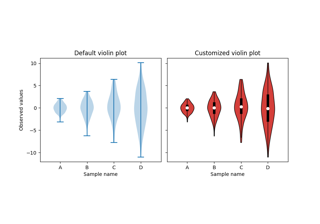
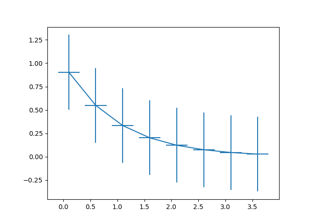
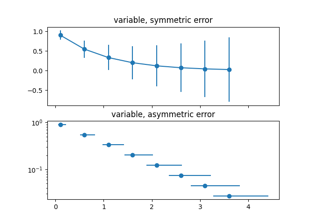
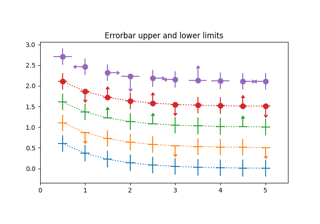
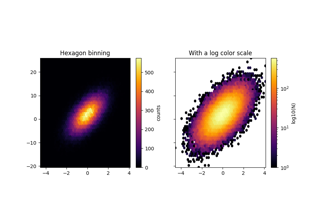
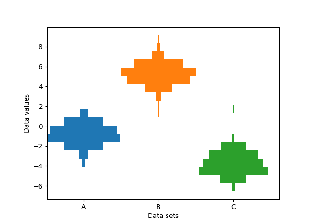
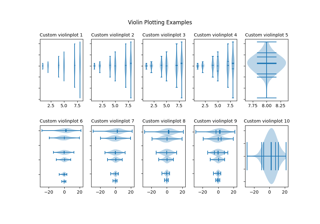
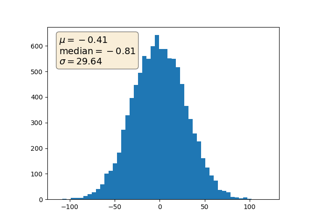
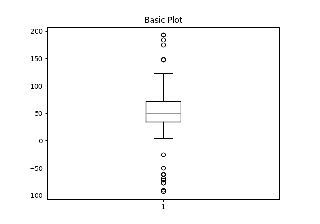
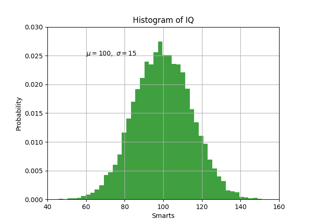
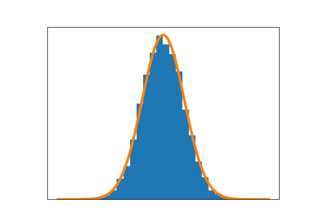
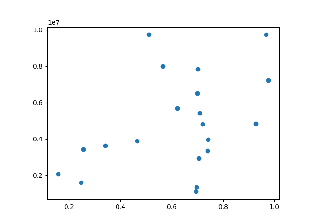
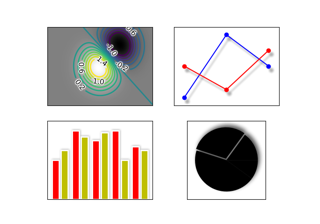
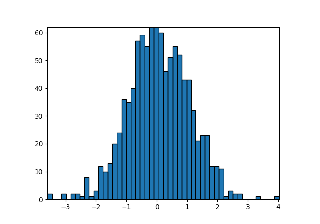
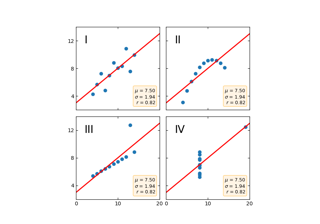
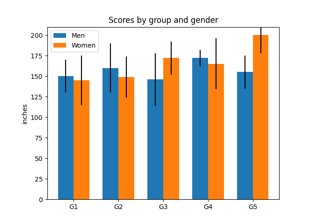
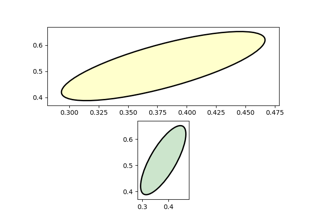
Statistics#
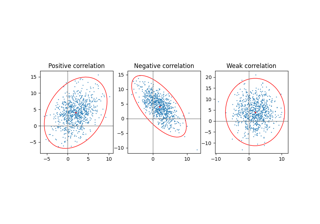
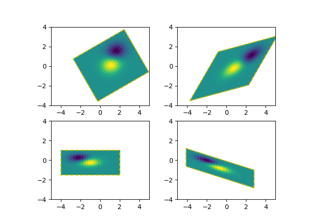
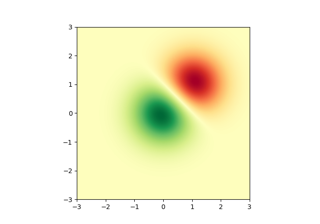
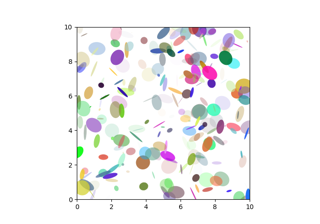
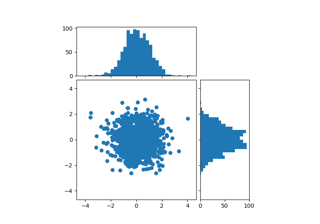
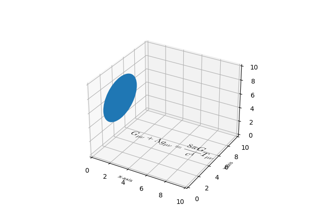
Plot a confidence ellipse of a two-dimensional dataset
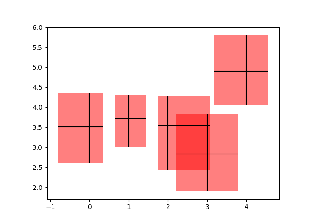
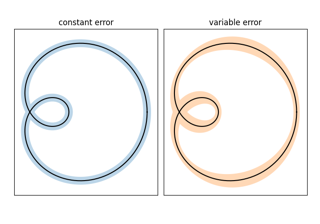
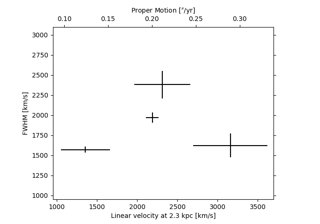
Creating boxes from error bars using PatchCollection
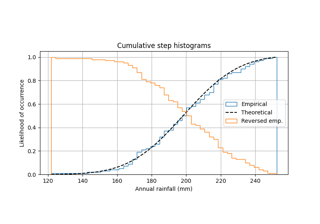
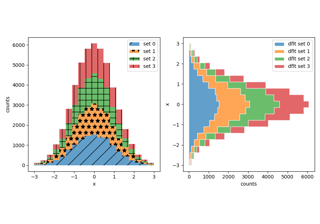
Using histograms to plot a cumulative distribution
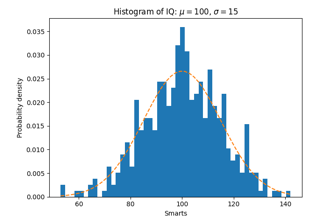
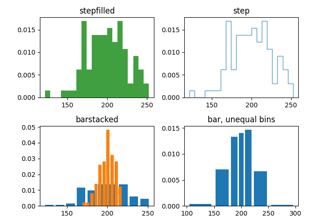
Demo of the histogram function's different histtype settings
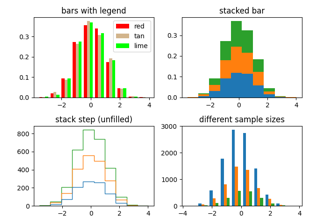
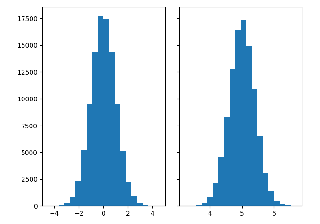
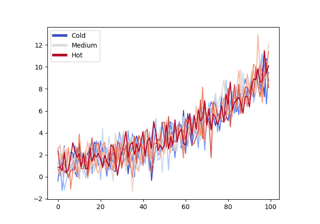
The histogram (hist) function with multiple data sets
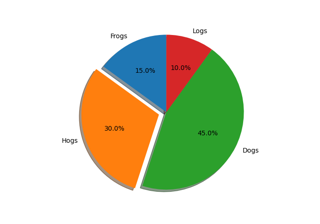
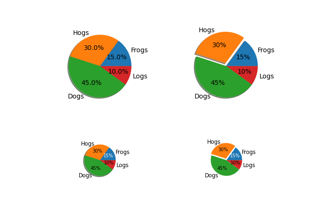
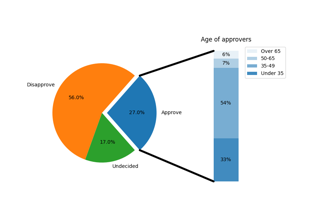
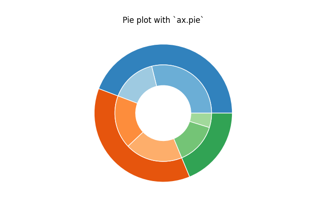
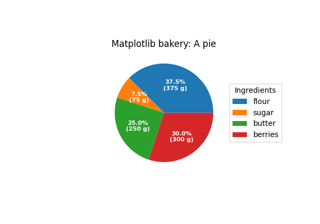
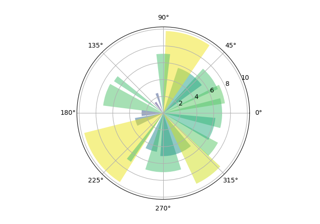
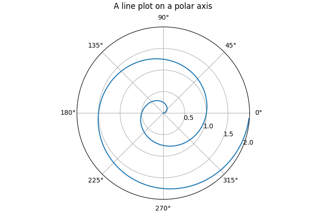
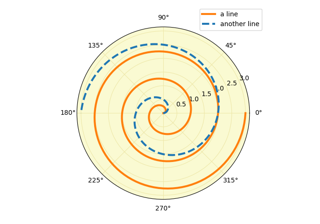
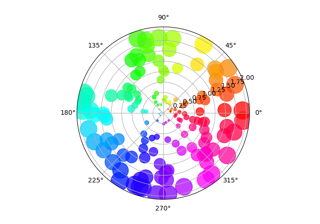
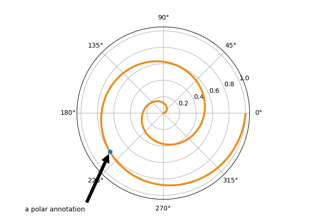
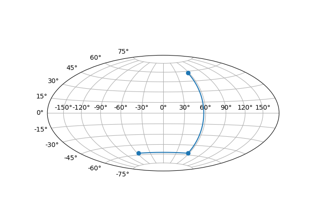
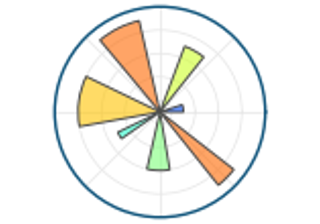
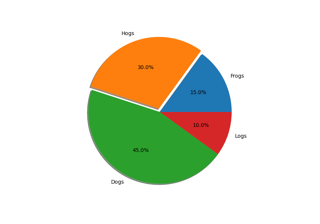
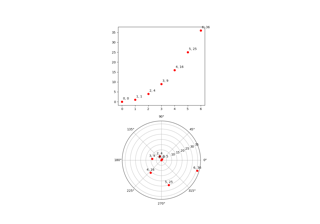
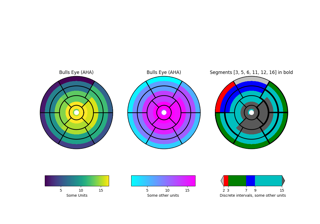
Pie and polar charts#
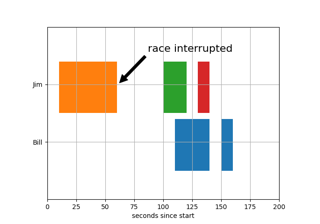
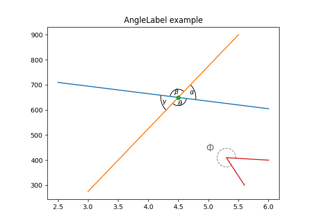
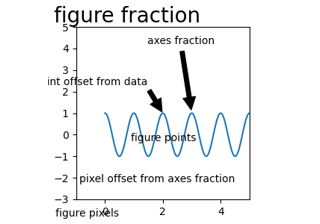
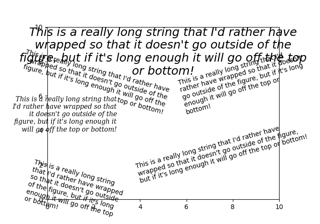
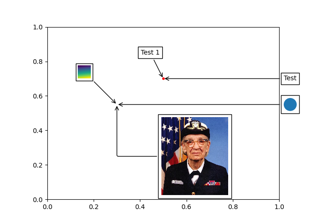
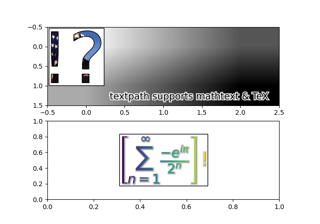
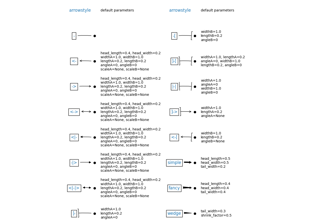
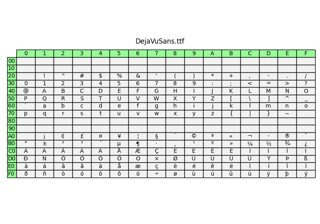
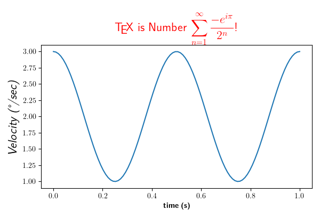
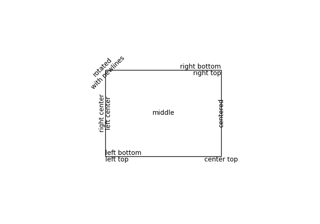
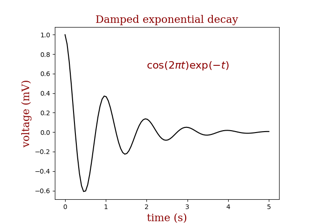
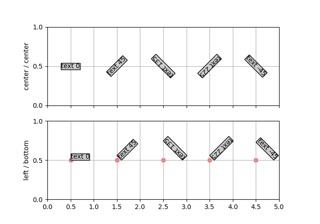
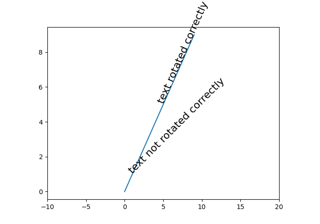
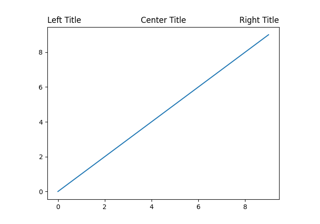
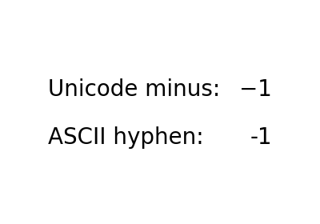
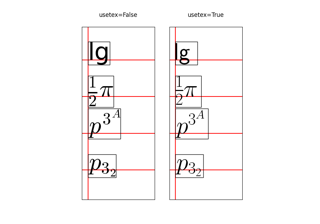
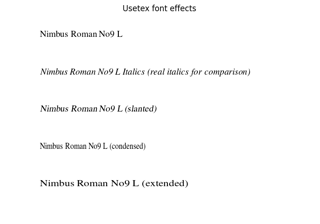
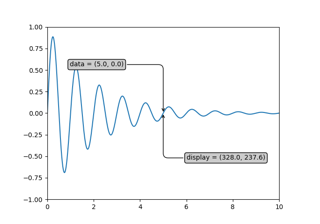
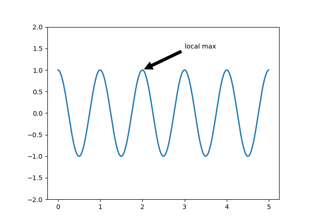
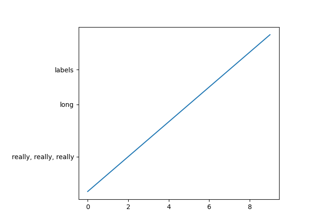
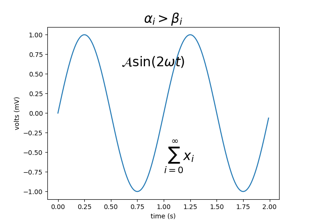
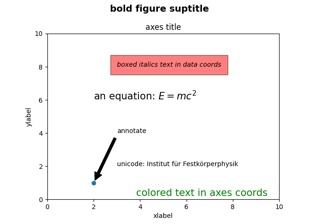
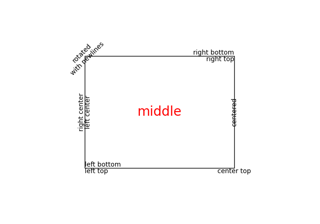
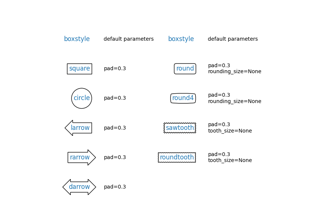
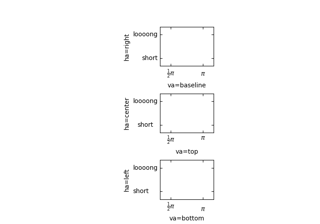
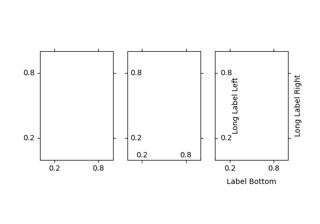
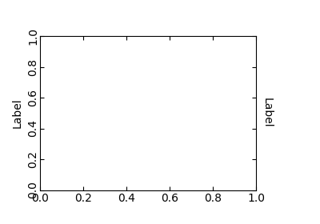
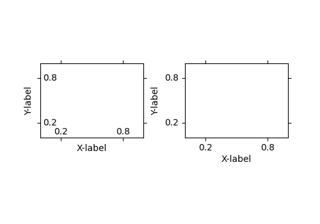
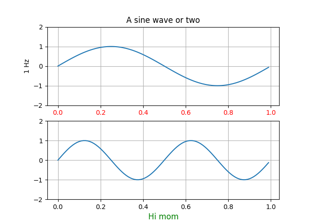
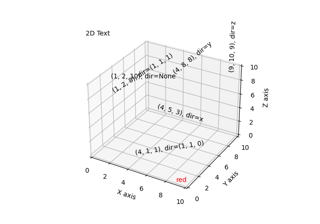
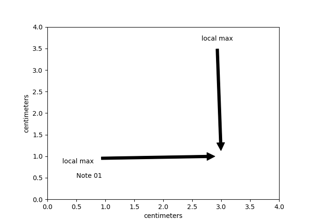
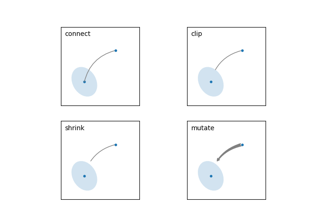
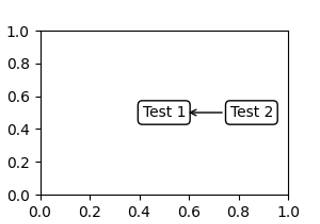
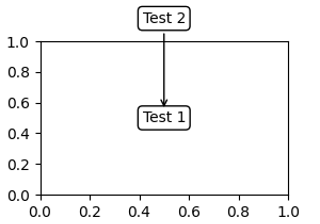
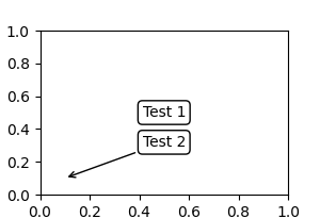
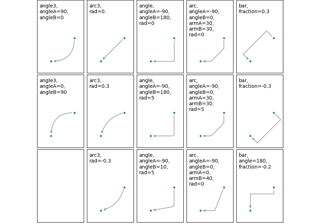
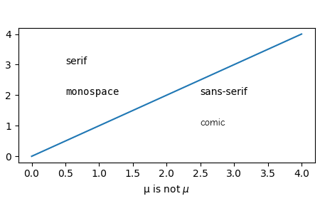
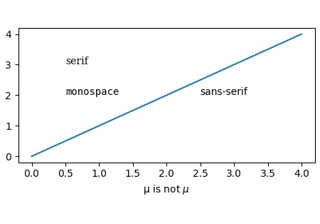
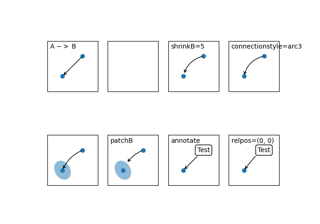
Text, labels and annotations#
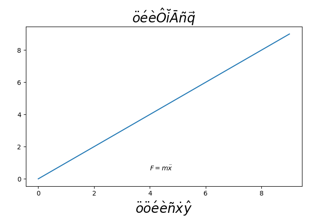
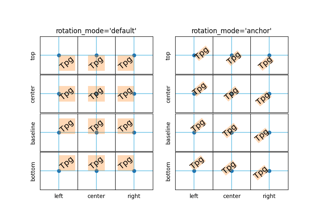
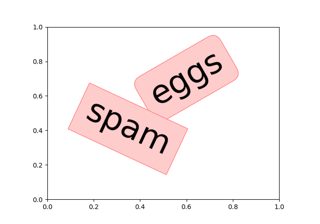

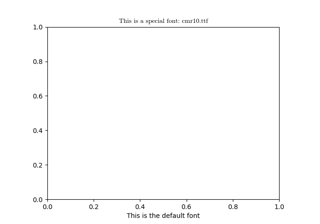
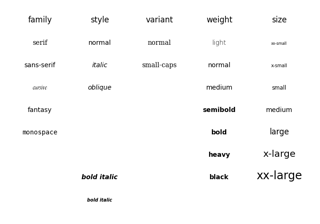
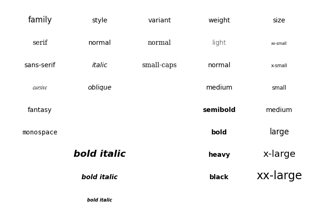
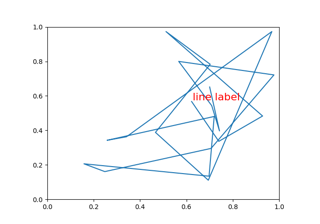
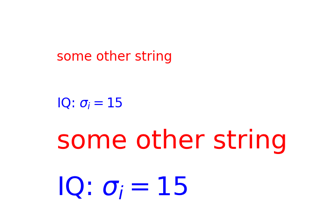
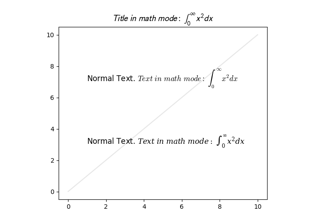
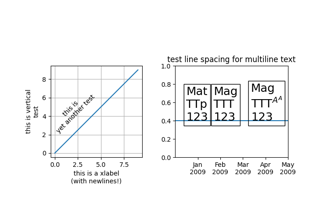
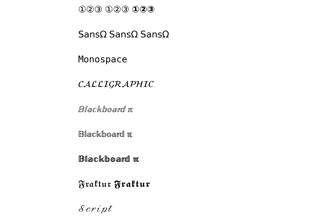
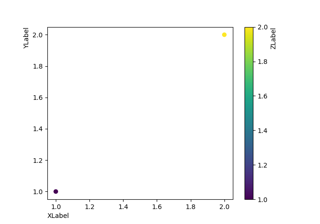
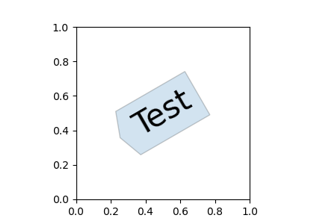
Controlling style of text and labels using a dictionary
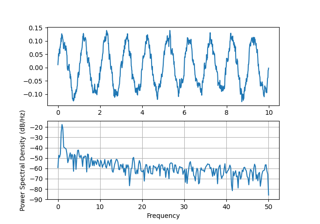
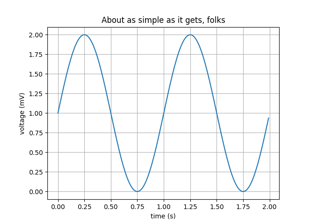
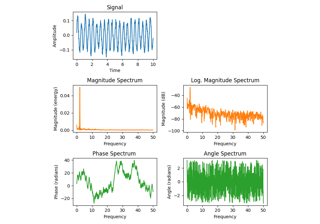
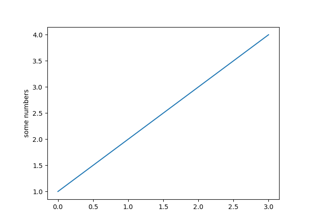
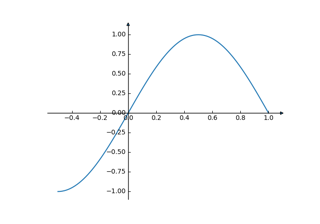
pyplot#

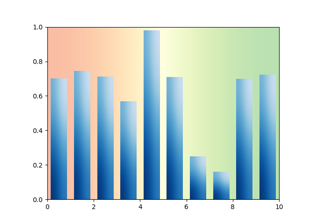
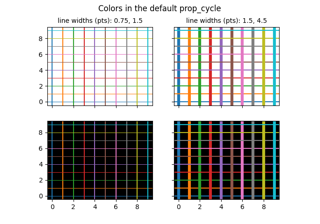
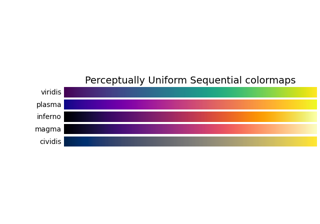
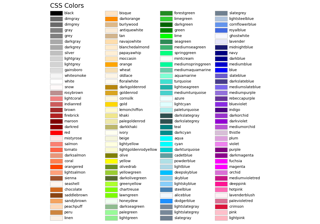
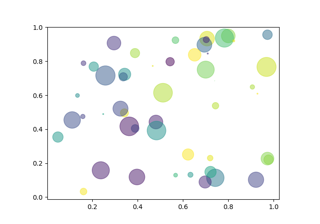
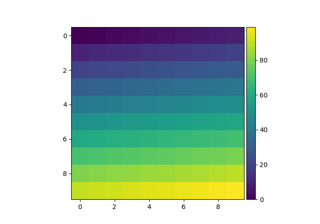
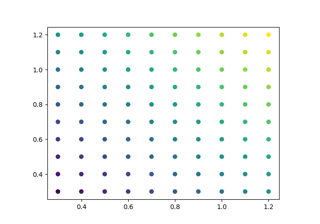
Color#
For more in-depth information about the colormaps available in matplotlib as well as a description of their properties, see the colormaps tutorial.
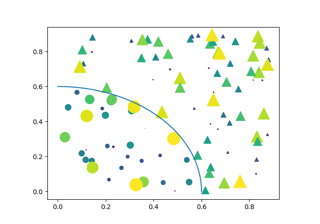
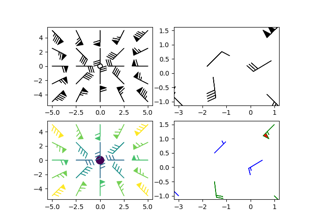
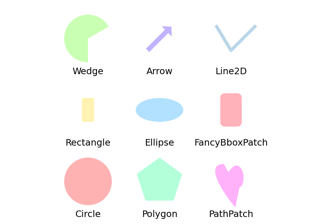
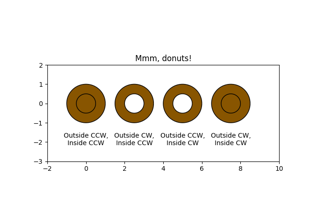
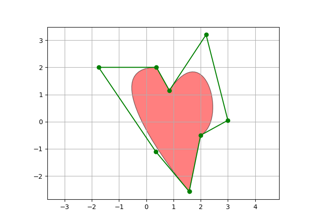
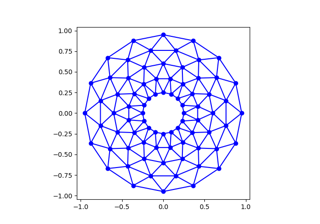
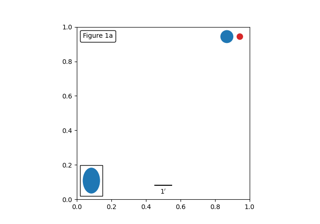
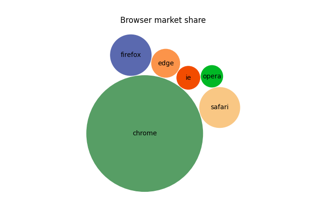
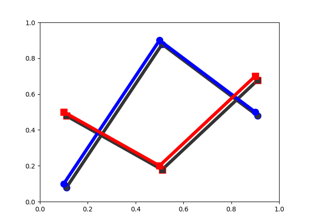
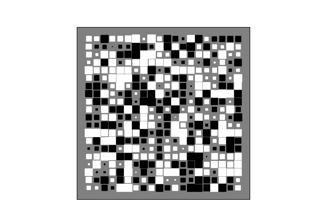
Shapes and collections#
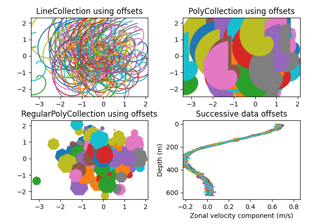
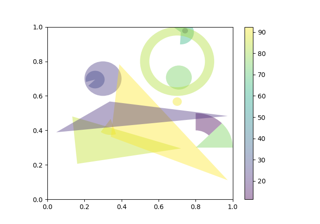
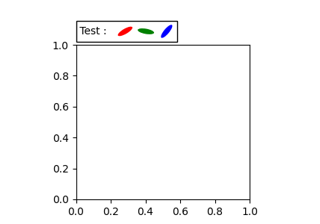
Line, Poly and RegularPoly Collection with autoscaling
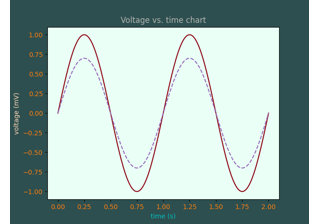
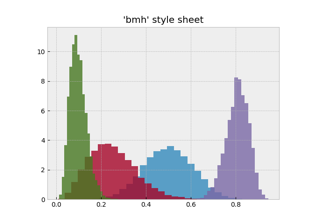
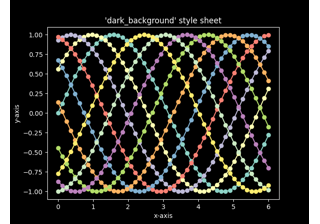
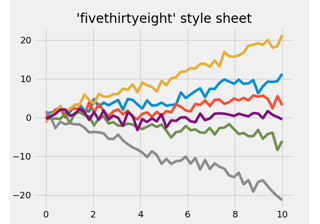
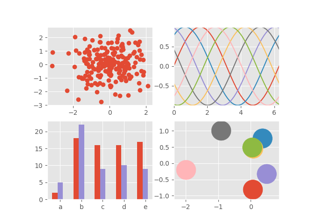
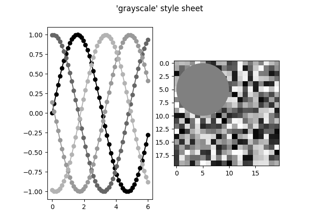
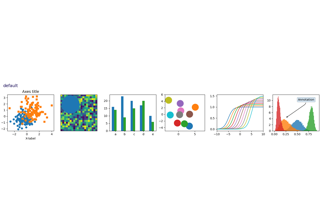
Style sheets#
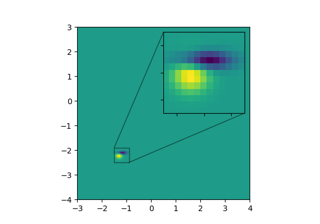
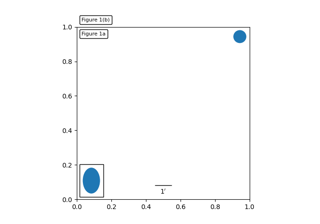
axes_grid1#
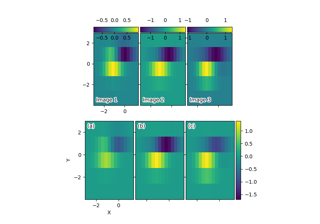
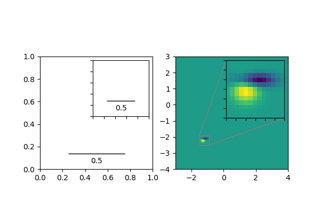
Controlling the position and size of colorbars with Inset Axes
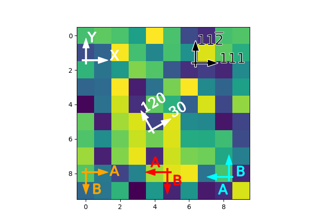
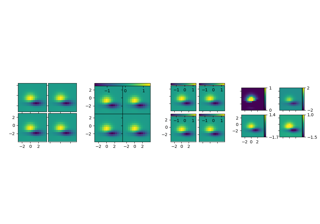
axisartist#
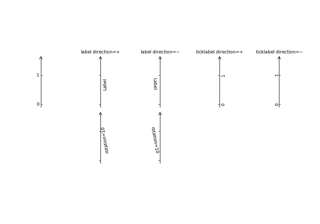
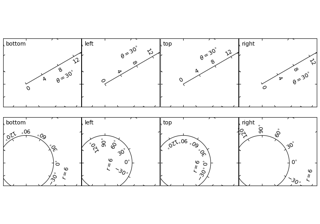
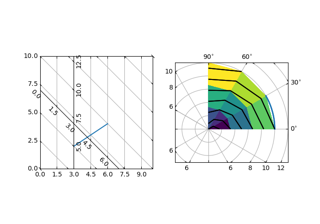
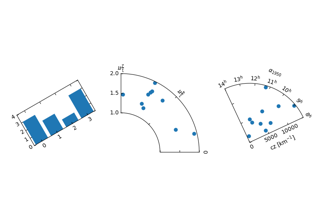
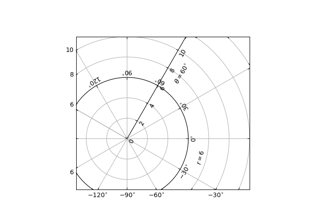
mpl_toolkits.axisartist.floating_axes features
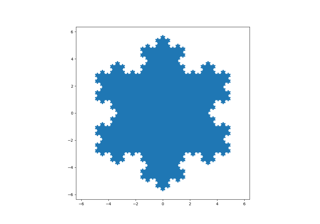
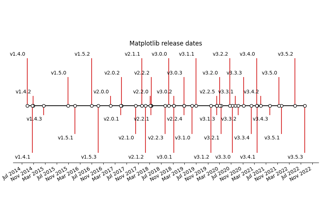
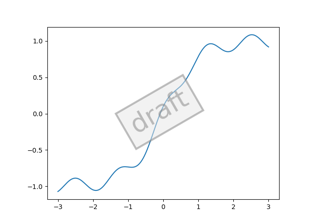
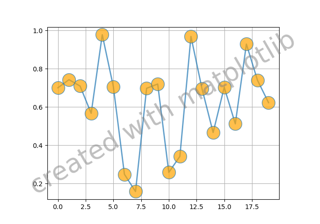
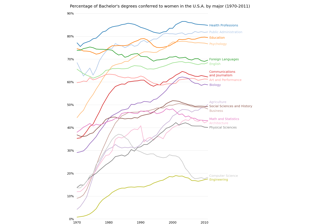
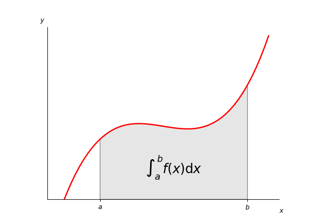
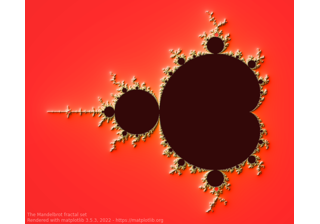
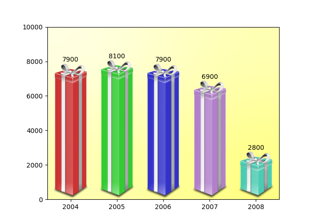
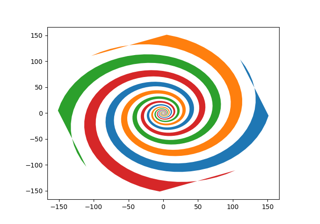
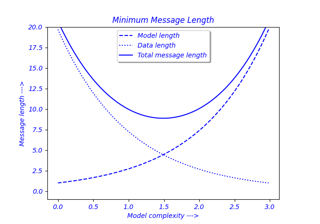
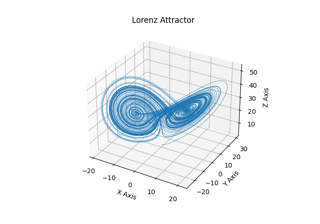
Showcase#

Animation#


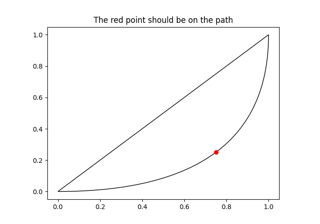
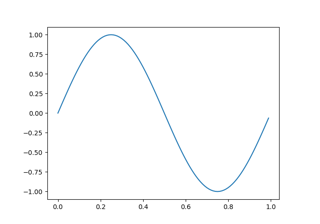
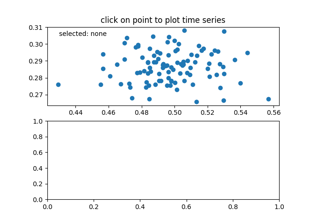
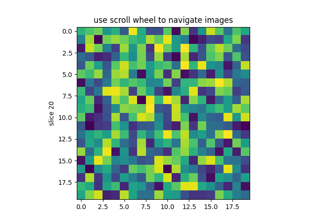
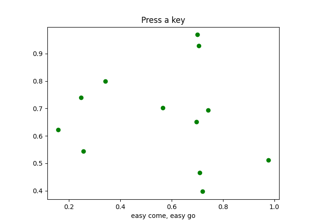
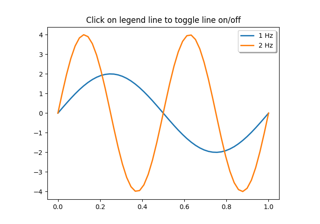
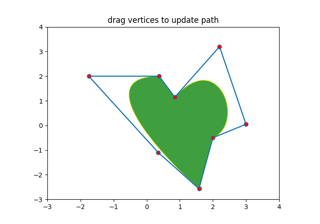
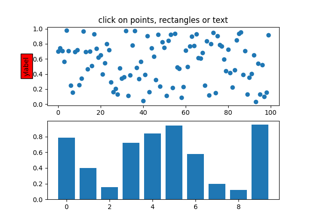
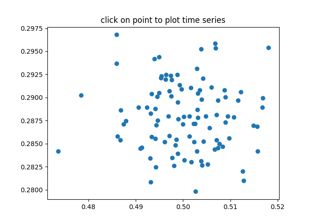
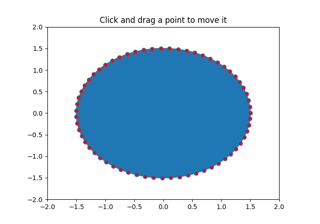
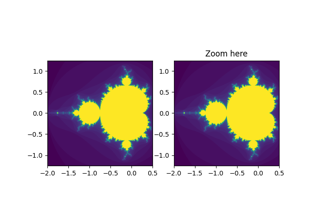
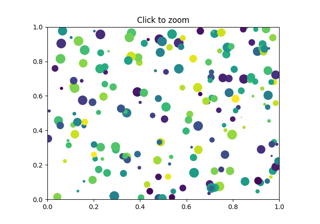
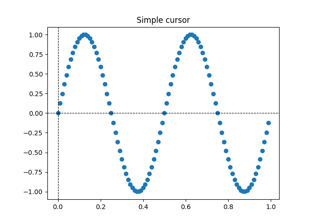
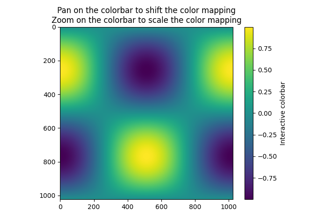
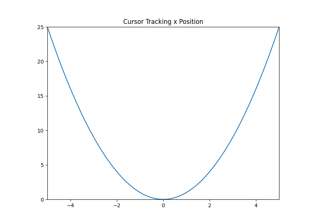
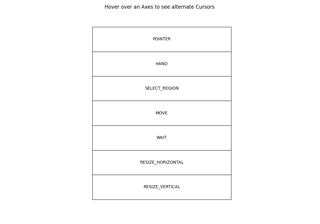
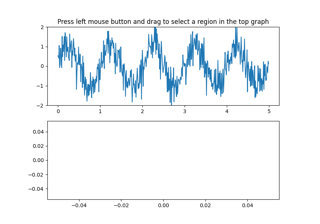
Event handling#
Matplotlib supports event handling with a GUI neutral event model, so you can connect to Matplotlib events without knowledge of what user interface Matplotlib will ultimately be plugged in to. This has two advantages: the code you write will be more portable, and Matplotlib events are aware of things like data coordinate space and which axes the event occurs in so you don't have to mess with low level transformation details to go from canvas space to data space. Object picking examples are also included.


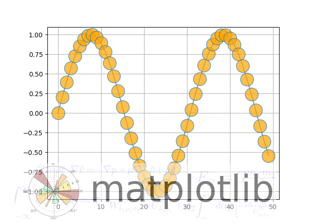
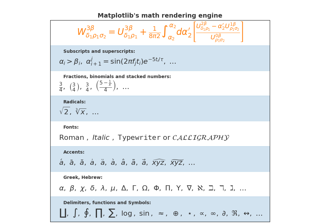
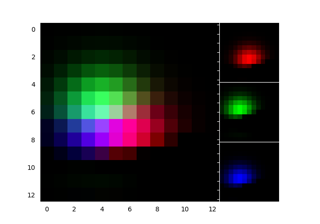
Front Page#
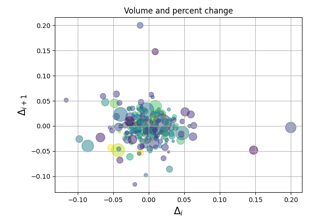
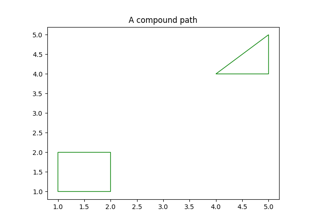
Miscellaneous#


Building histograms using Rectangles and PolyCollections


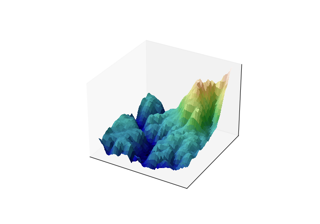
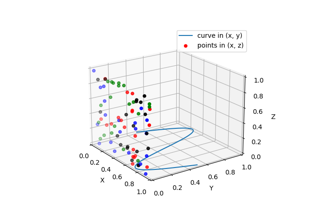
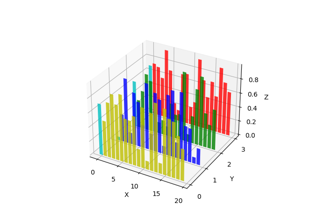
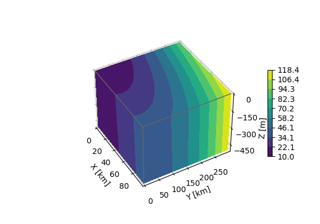
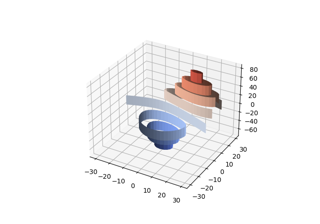
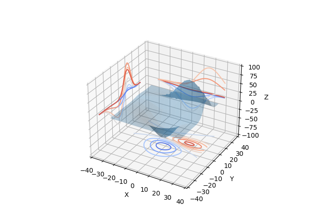
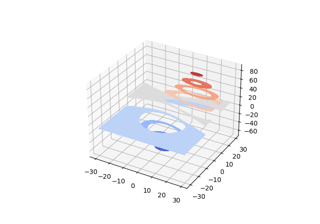
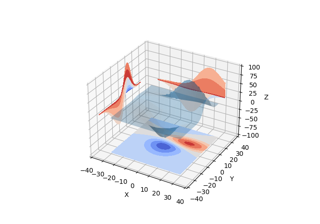
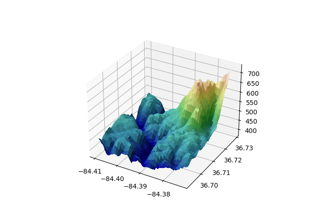
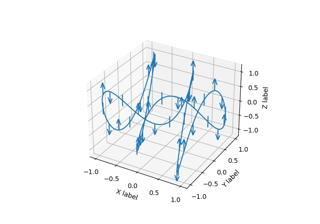
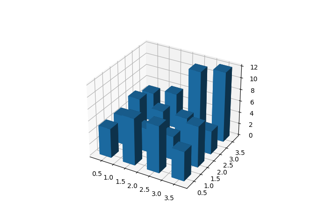
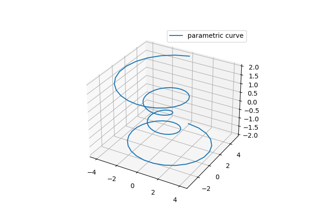
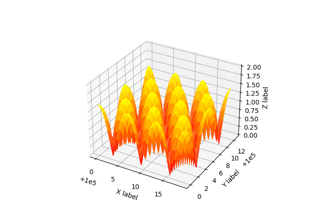
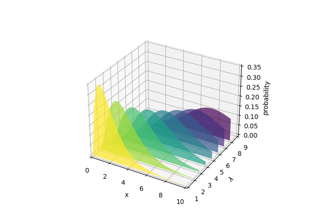
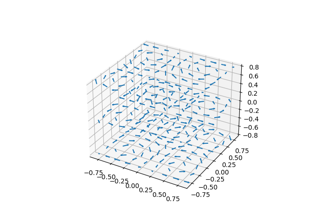
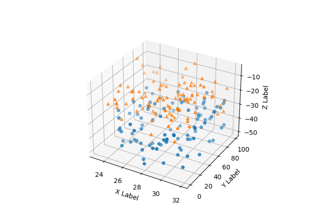
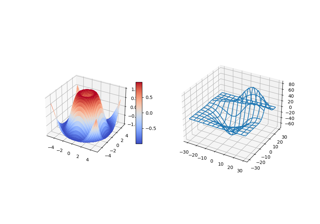
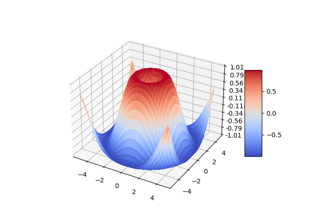
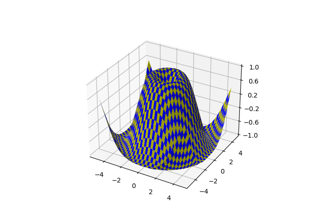
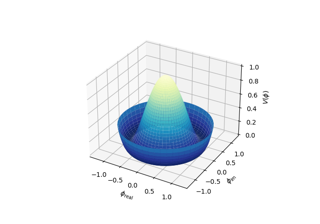
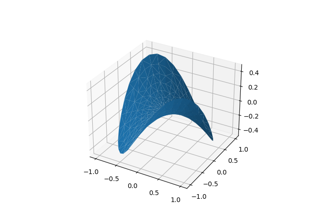
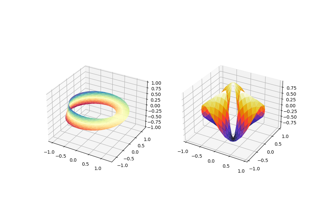
3D plotting#

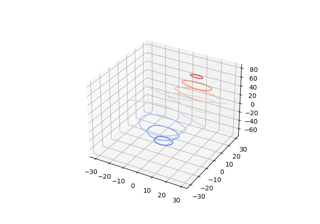
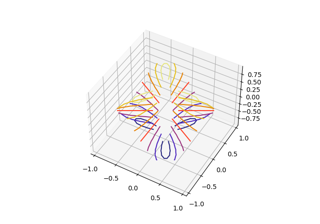
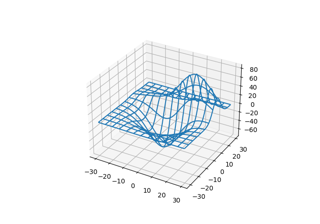
Demonstrates plotting contour (level) curves in 3D
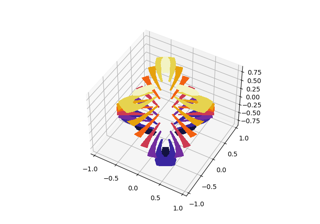
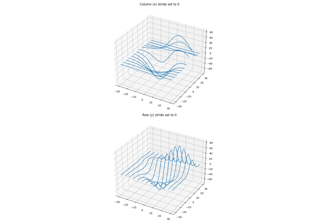
Demonstrates plotting contour (level) curves in 3D using the extend3d option

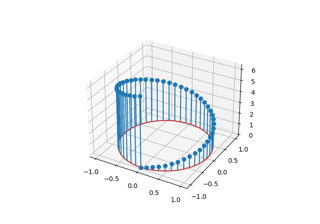
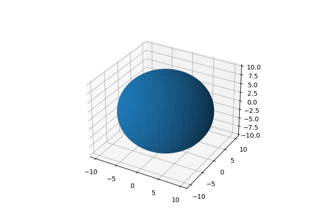
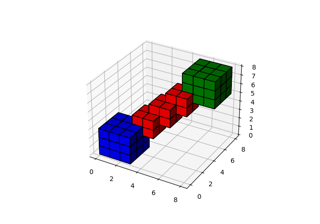
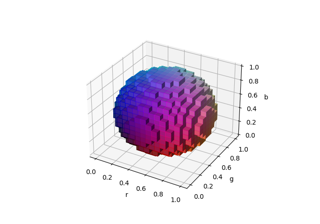
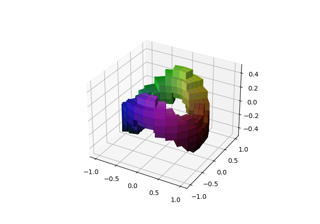
3D voxel / volumetric plot with cylindrical coordinates

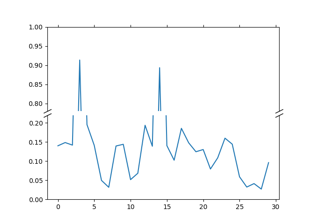
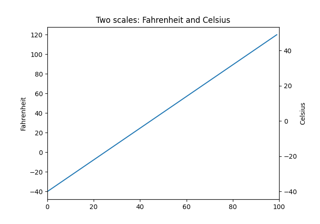
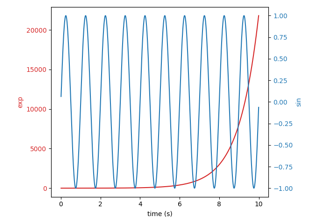
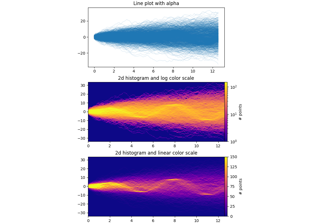
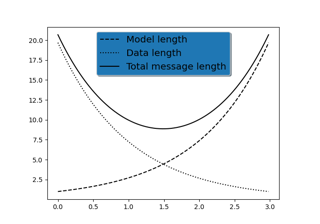
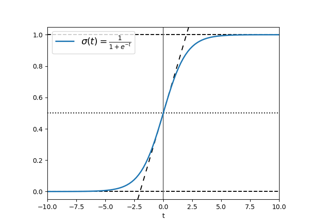
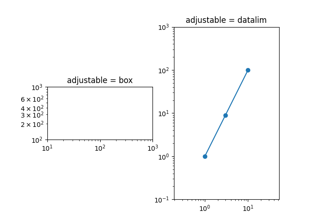
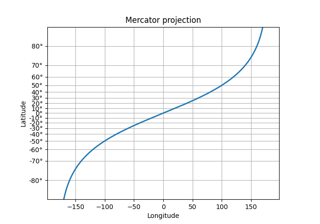
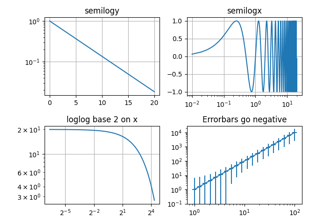
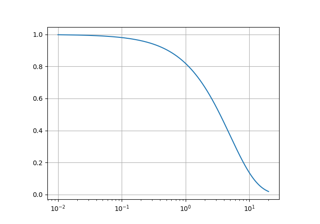
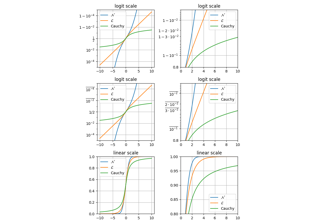
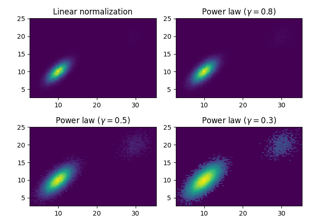
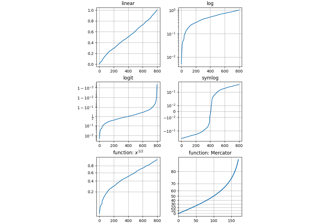
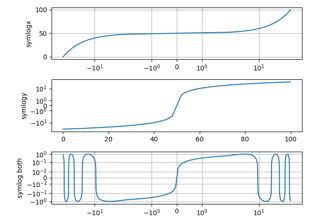
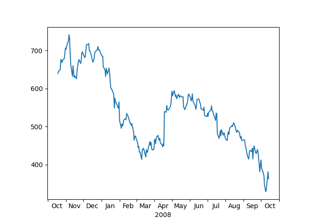
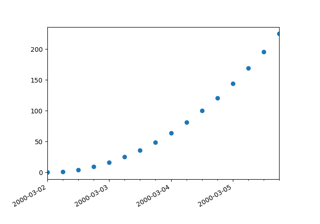
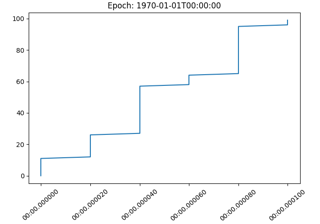
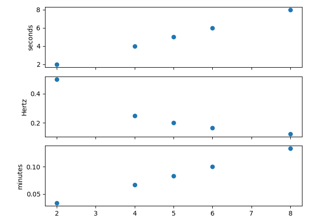
Scales#
These examples cover how different scales are handled in Matplotlib.
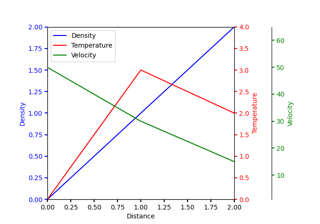
Specialty Plots#
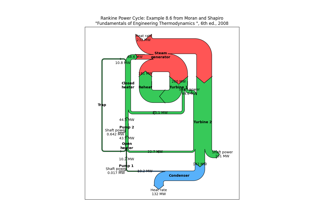
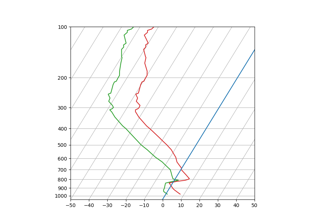
SkewT-logP diagram: using transforms and custom projections
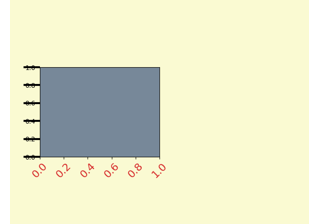
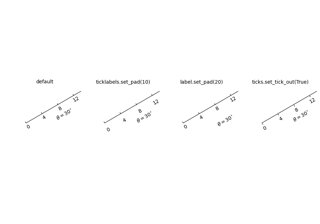
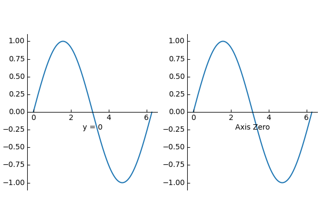
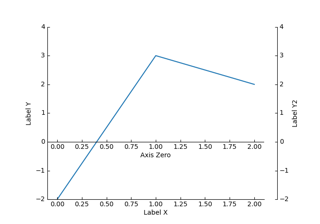
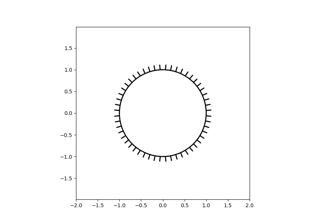
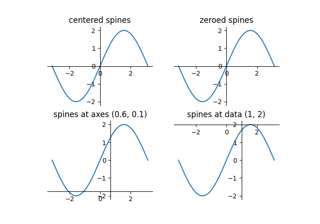
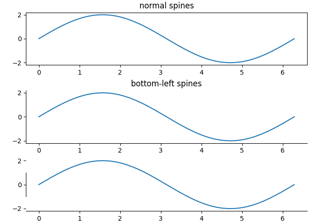
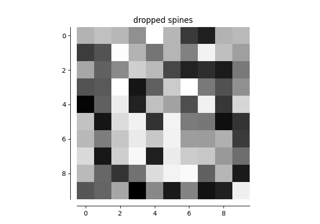
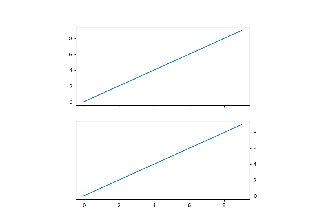
Spines#
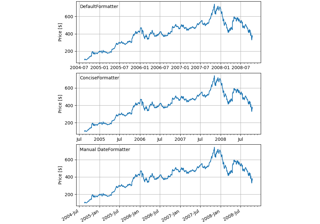
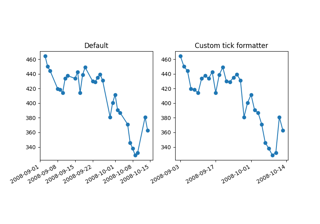
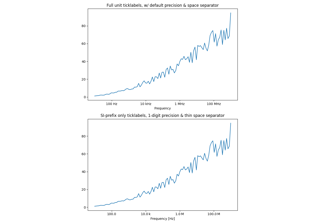
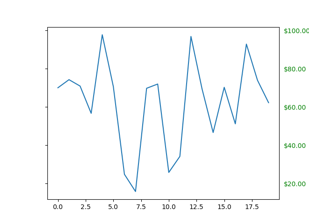
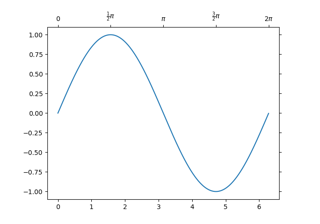
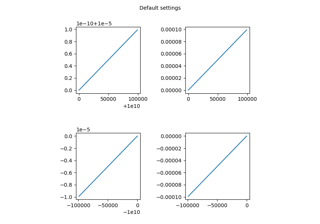
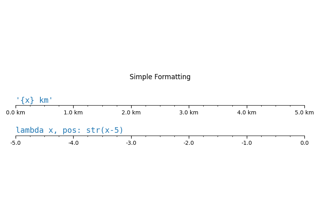
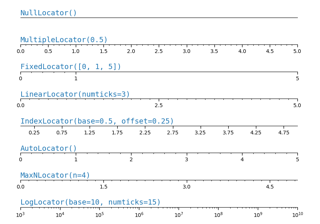
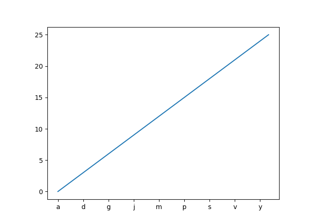
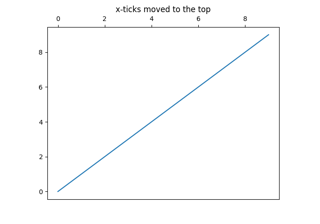
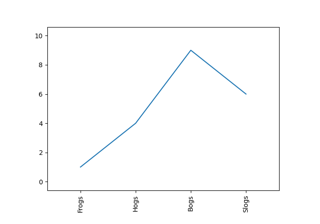
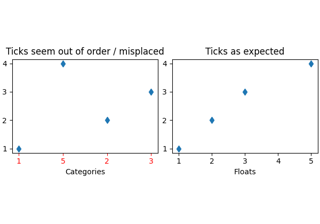
Ticks#
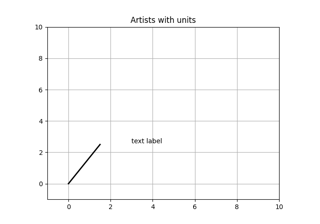
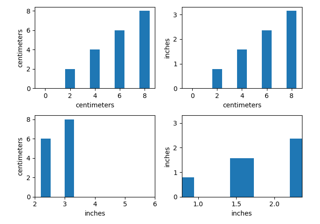
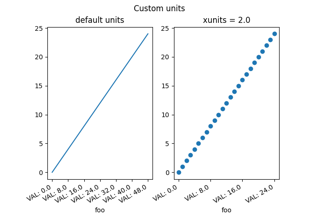
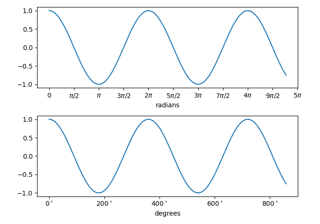
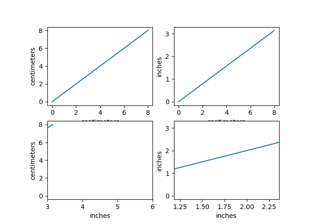
Units#
These examples cover the many representations of units in Matplotlib.

Embedding Matplotlib in graphical user interfaces#
You can embed Matplotlib directly into a user interface application by following the embedding_in_SOMEGUI.py examples here. Currently Matplotlib supports PyQt/PySide, PyGObject, Tkinter, and wxPython.
When embedding Matplotlib in a GUI, you must use the Matplotlib API directly rather than the pylab/pyplot proceedural interface, so take a look at the examples/api directory for some example code working with the API.


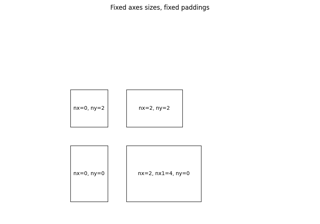
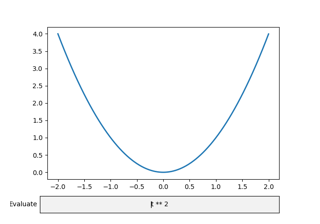
Userdemo#

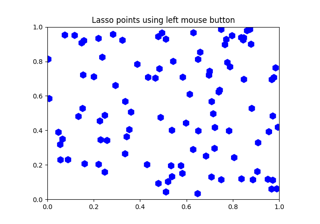
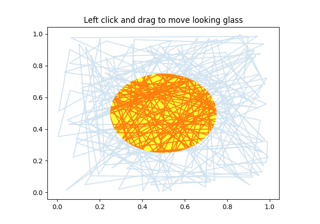
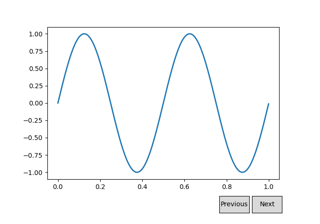
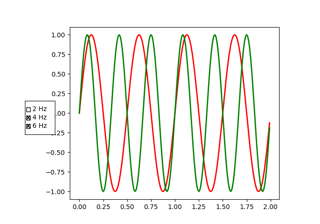
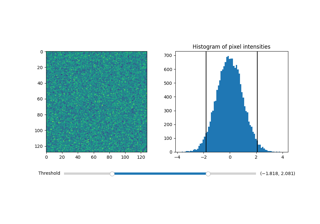
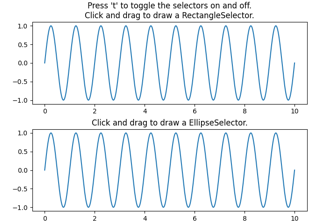
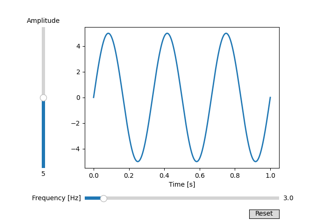
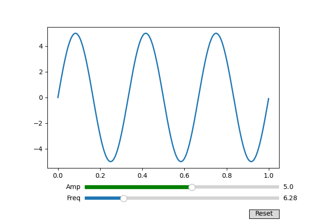
Widgets#
Examples of how to write primitive, but GUI agnostic, widgets in matplotlib


Keywords: matplotlib code example, codex, python plot, pyplot Gallery generated by Sphinx-Gallery