plt.subplots
histtype
HBoxDivider
AxesDivider
mpl_toolkits.axisartist.floating_axes
Bar Label Demo
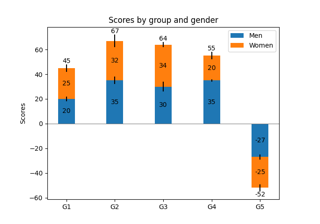
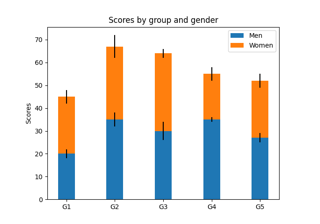
Stacked bar chart
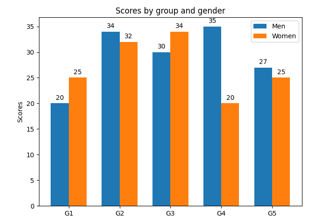
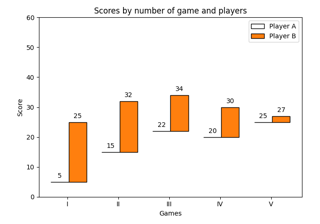
Grouped bar chart with labels
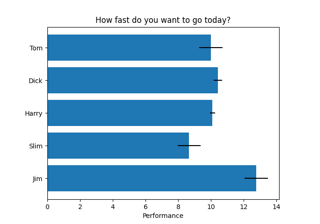
Horizontal bar chart
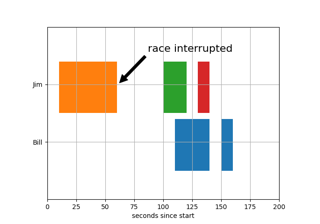
Broken Barh
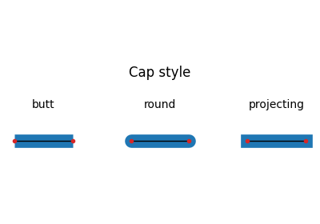
CapStyle
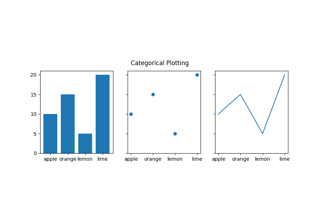
Plotting categorical variables
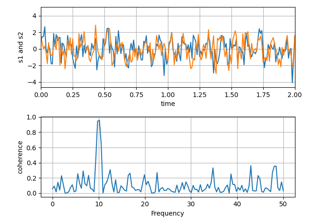
Plotting the coherence of two signals
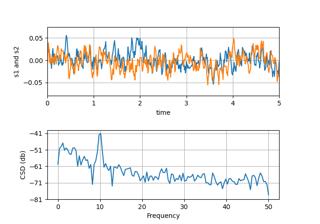
CSD Demo
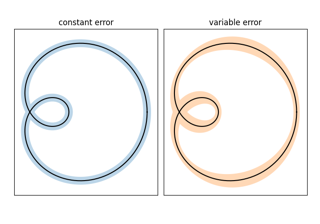
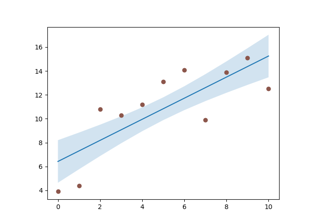
Curve with error band
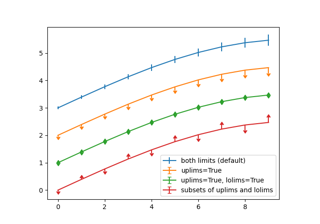
Errorbar limit selection
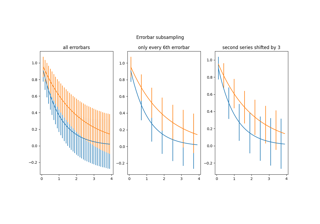
Errorbar subsampling
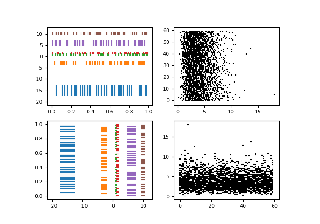
EventCollection Demo
Eventplot Demo
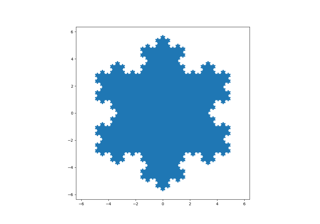
Filled polygon
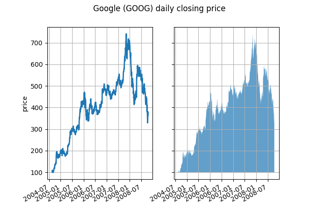
Fill Between and Alpha
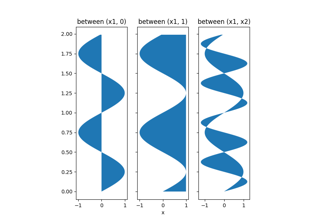
Filling the area between lines
Fill Betweenx Demo
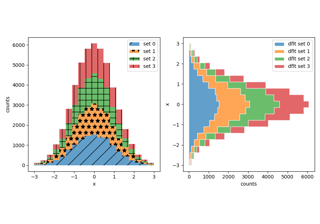
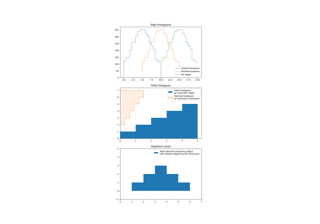
Hatch-filled histograms
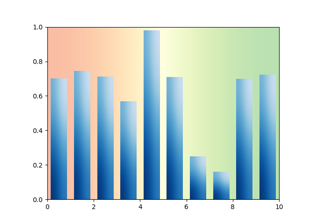
Bar chart with gradients
Hat graph
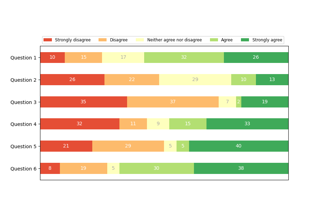
Discrete distribution as horizontal bar chart
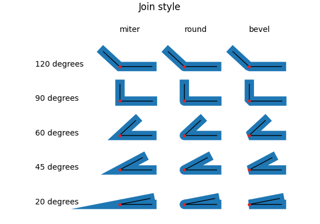
JoinStyle
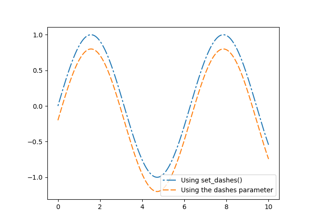
Customizing dashed line styles
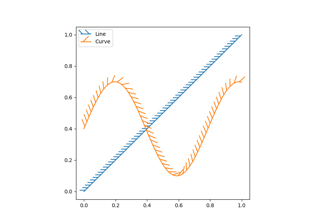
Lines with a ticked patheffect
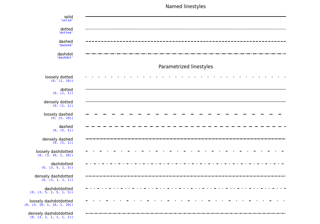
Linestyles
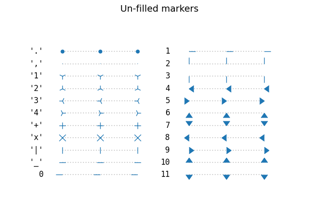
Marker reference
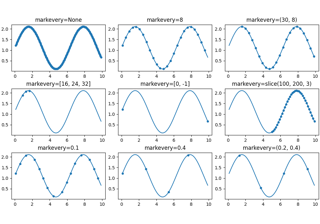
Markevery Demo
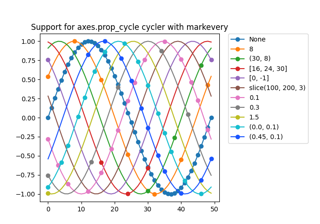
prop_cycle property markevery in rcParams
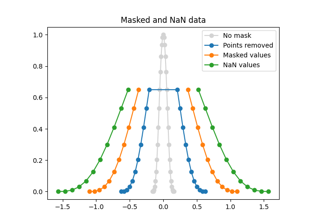
Plotting masked and NaN values
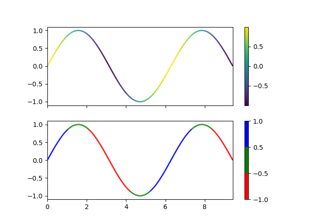
Multicolored lines
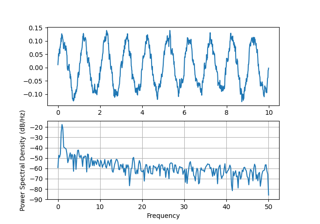
Psd Demo
Scatter Custom Symbol
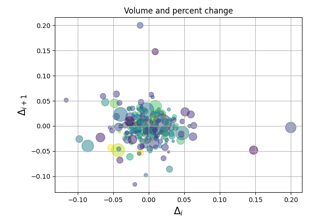
Scatter Demo2
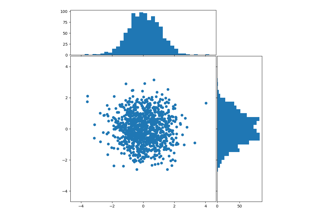
Scatter plot with histograms
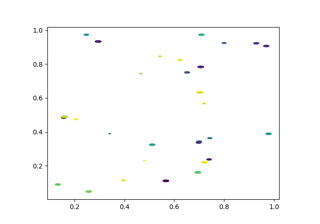
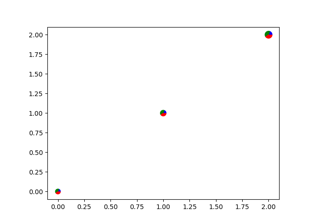
Scatter Masked
Scatter plot with pie chart markers
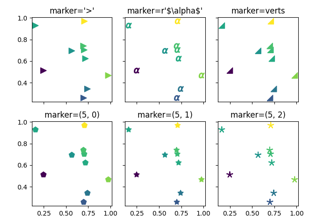
Marker examples
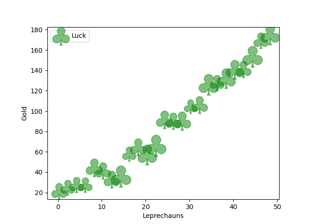
Scatter Symbol
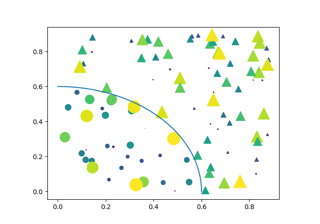
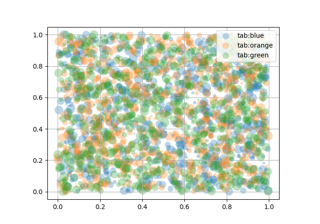
Scatter plots with a legend
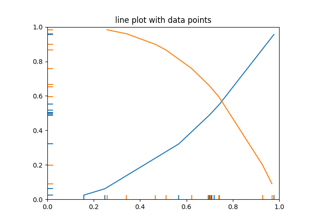
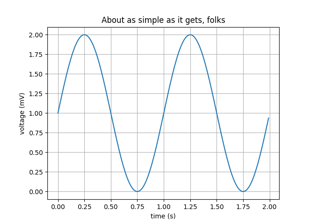
Simple Plot
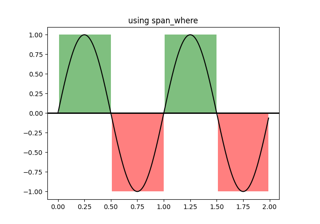
Using span_where
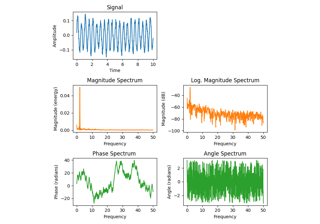
Spectrum Representations
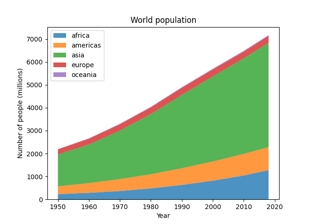
Stackplots and streamgraphs
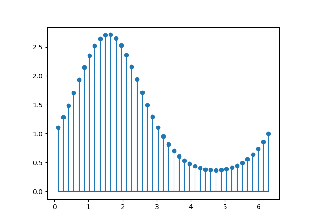
Stairs Demo
Stem Plot
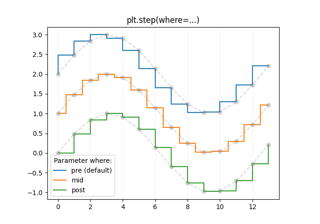
Step Demo
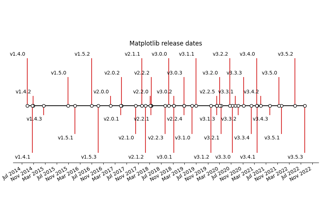
Creating a timeline with lines, dates, and text
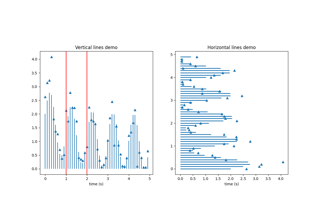
hlines and vlines
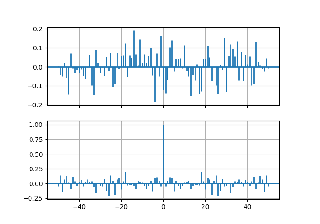
Cross- and Auto-Correlation Demo