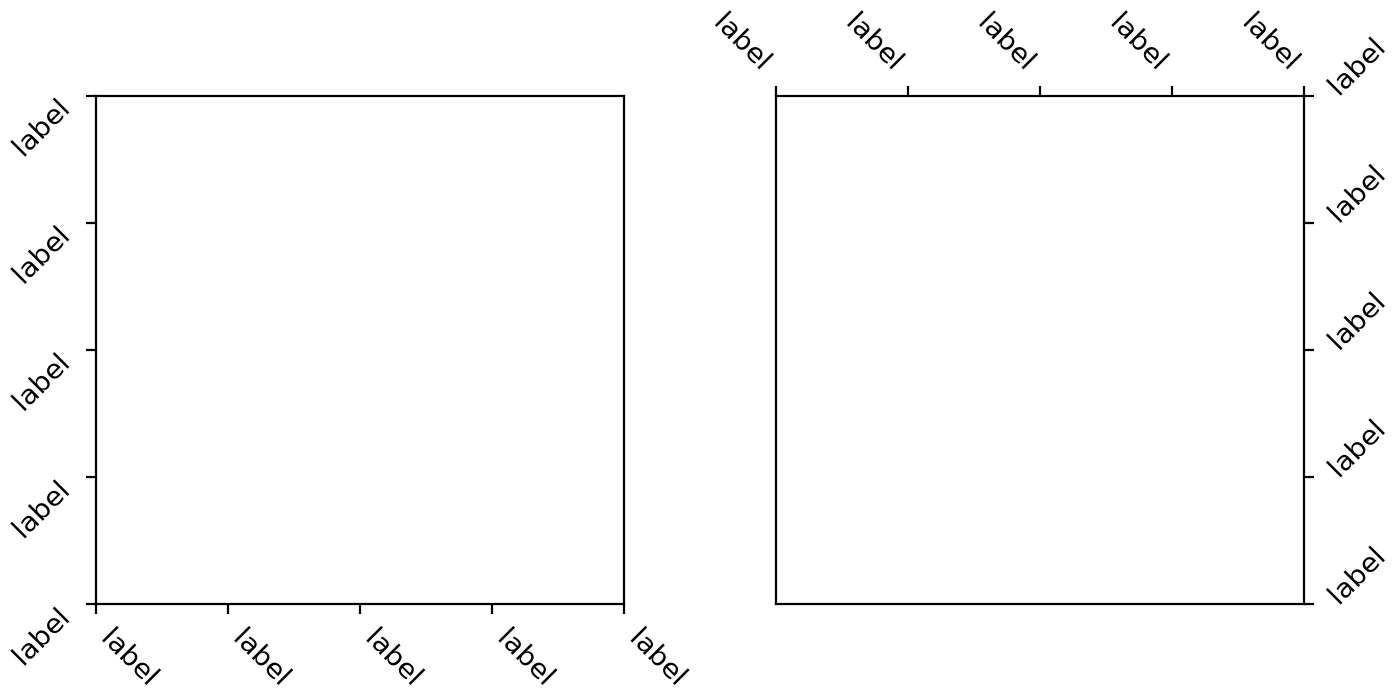
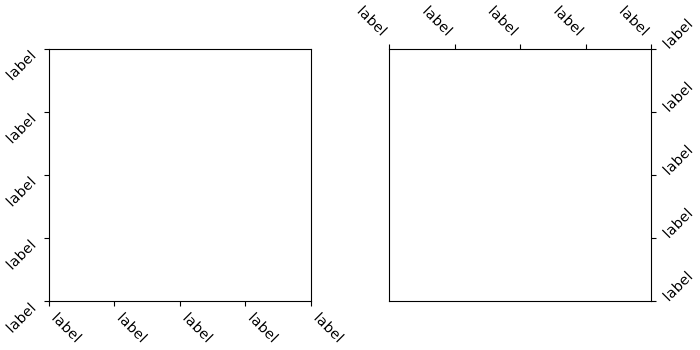
xtick and ytick rotation modes#
A new feature has been added for handling rotation of xtick and ytick
labels more intuitively. The new rotation modes
"xtick" and "ytick" automatically adjust the alignment of rotated tick labels,
so that the text points towards their anchor point, i.e. ticks. This works for
all four sides of the plot (bottom, top, left, right), reducing the need for
manual adjustments when rotating labels.
import matplotlib.pyplot as plt

fig, (ax1, ax2) = plt.subplots(1, 2, figsize=(7, 3.5), layout='constrained')

pos = range(5)
labels = ['label'] * 5
ax1.set_xticks(pos, labels, rotation=-45, rotation_mode='xtick')
ax1.set_yticks(pos, labels, rotation=45, rotation_mode='ytick')
ax2.xaxis.tick_top()
ax2.set_xticks(pos, labels, rotation=-45, rotation_mode='xtick')
ax2.yaxis.tick_right()
ax2.set_yticks(pos, labels, rotation=45, rotation_mode='ytick')

plt.show()
(Source code, 2x.png, png)