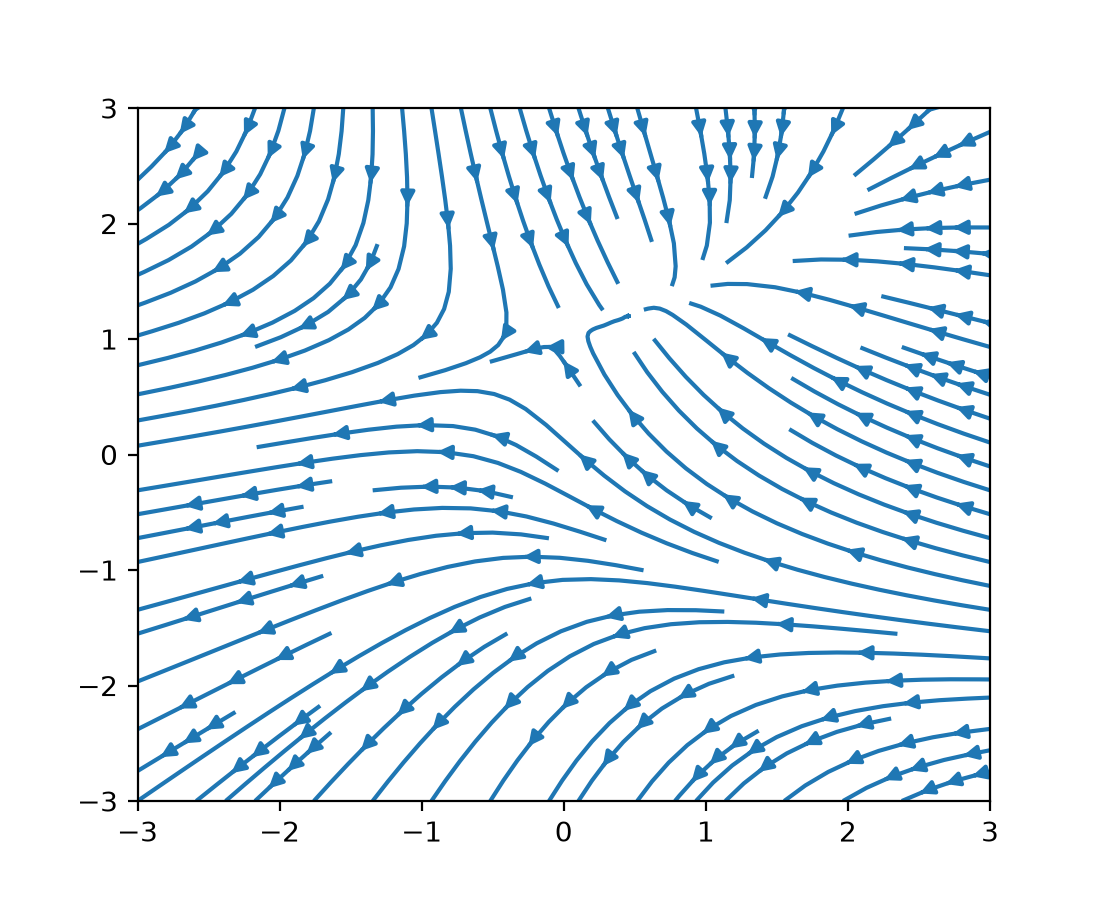
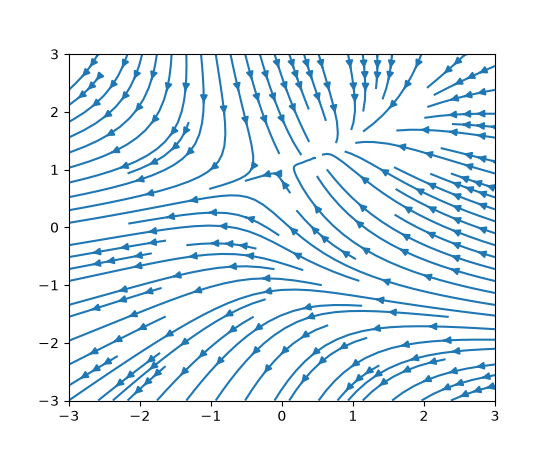
Multiple arrows on a streamline#
A new num_arrows argument has been added to streamplot that
allows more than one arrow to be added to each streamline:
import matplotlib.pyplot as plt
import numpy as np

w = 3
Y, X = np.mgrid[-w:w:100j, -w:w:100j]
U = -1 - X**2 + Y
V = 1 + X - Y**2

fig, ax = plt.subplots()
ax.streamplot(X, Y, U, V, num_arrows=3)

plt.show()
(Source code, 2x.png, png)