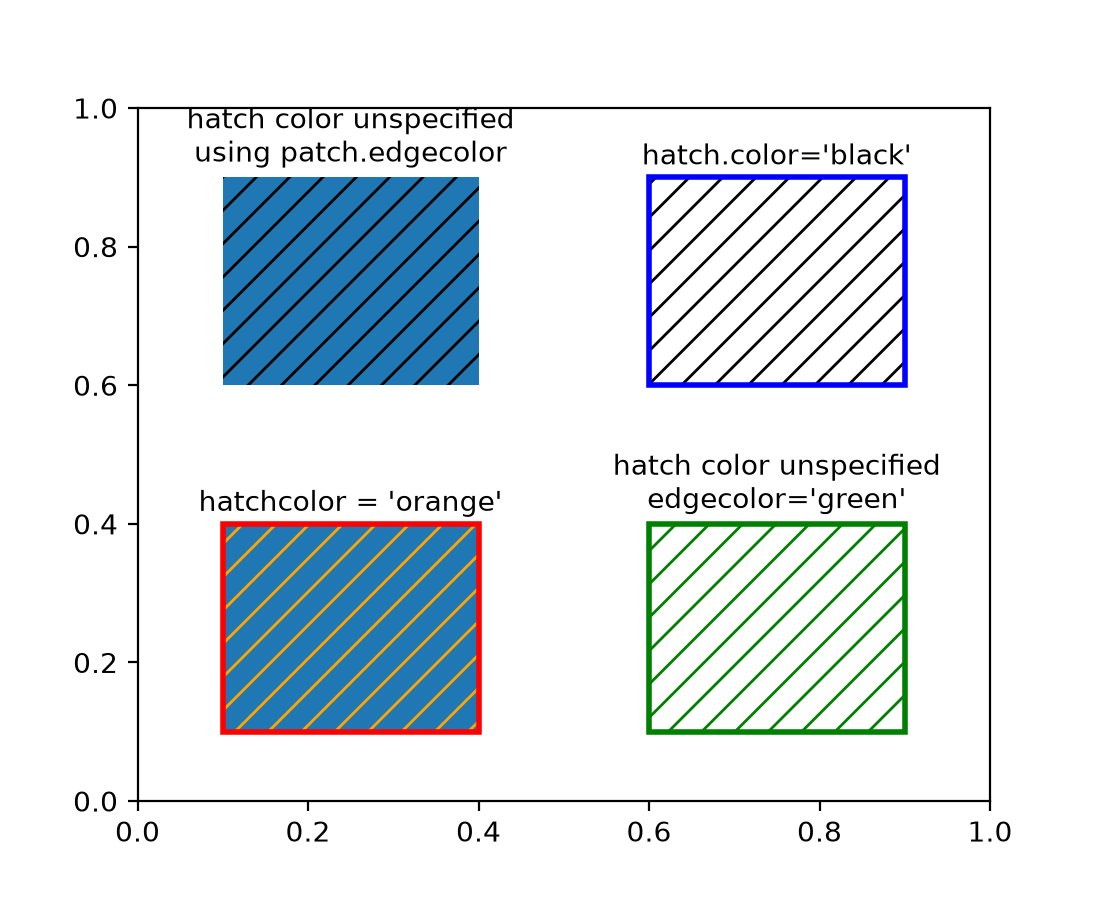
Separated hatchcolor from edgecolor#
When the hatchcolor parameter is specified, it will be used for the hatch.
If it is not specified, it will fall back to using rcParams["hatch.color"] (default: 'edge').
The special value 'edge' uses the patch edgecolor, with a fallback to
rcParams["patch.edgecolor"] (default: 'black') if the patch edgecolor is 'none'.
Previously, hatch colors were the same as edge colors, with a fallback to
rcParams["hatch.color"] (default: 'edge') if the patch did not have an edge color.
import matplotlib as mpl
import matplotlib.pyplot as plt
from matplotlib.patches import Rectangle

fig, ax = plt.subplots()

# In this case, hatchcolor is orange
patch1 = Rectangle((0.1, 0.1), 0.3, 0.3, edgecolor='red', linewidth=2,
                   hatch='//', hatchcolor='orange')
ax.add_patch(patch1)

# When hatchcolor is not specified, it matches edgecolor
# In this case, hatchcolor is green
patch2 = Rectangle((0.6, 0.1), 0.3, 0.3, edgecolor='green', linewidth=2,
                   hatch='//', facecolor='none')
ax.add_patch(patch2)

# If both hatchcolor and edgecolor are not specified
# it will default to the 'patch.edgecolor' rcParam, which is black by default
# In this case, hatchcolor is black
patch3 = Rectangle((0.1, 0.6), 0.3, 0.3, hatch='//')
ax.add_patch(patch3)

# When using `hatch.color` in the `rcParams`
# edgecolor will now not overwrite hatchcolor
# In this case, hatchcolor is black
with plt.rc_context({'hatch.color': 'black'}):
    patch4 = Rectangle((0.6, 0.6), 0.3, 0.3, edgecolor='blue', linewidth=2,
                       hatch='//', facecolor='none')

# hatchcolor is black (it uses the `hatch.color` rcParam value)
patch4.set_edgecolor('blue')
# hatchcolor is still black (here, it does not update when edgecolor changes)
ax.add_patch(patch4)

ax.annotate("hatchcolor = 'orange'",
            xy=(.5, 1.03), xycoords=patch1, ha='center', va='bottom')
ax.annotate("hatch color unspecified\nedgecolor='green'",
            xy=(.5, 1.03), xycoords=patch2, ha='center', va='bottom')
ax.annotate("hatch color unspecified\nusing patch.edgecolor",
            xy=(.5, 1.03), xycoords=patch3, ha='center', va='bottom')
ax.annotate("hatch.color='black'",
            xy=(.5, 1.03), xycoords=patch4, ha='center', va='bottom')

plt.show()
(Source code, 2x.png, png)

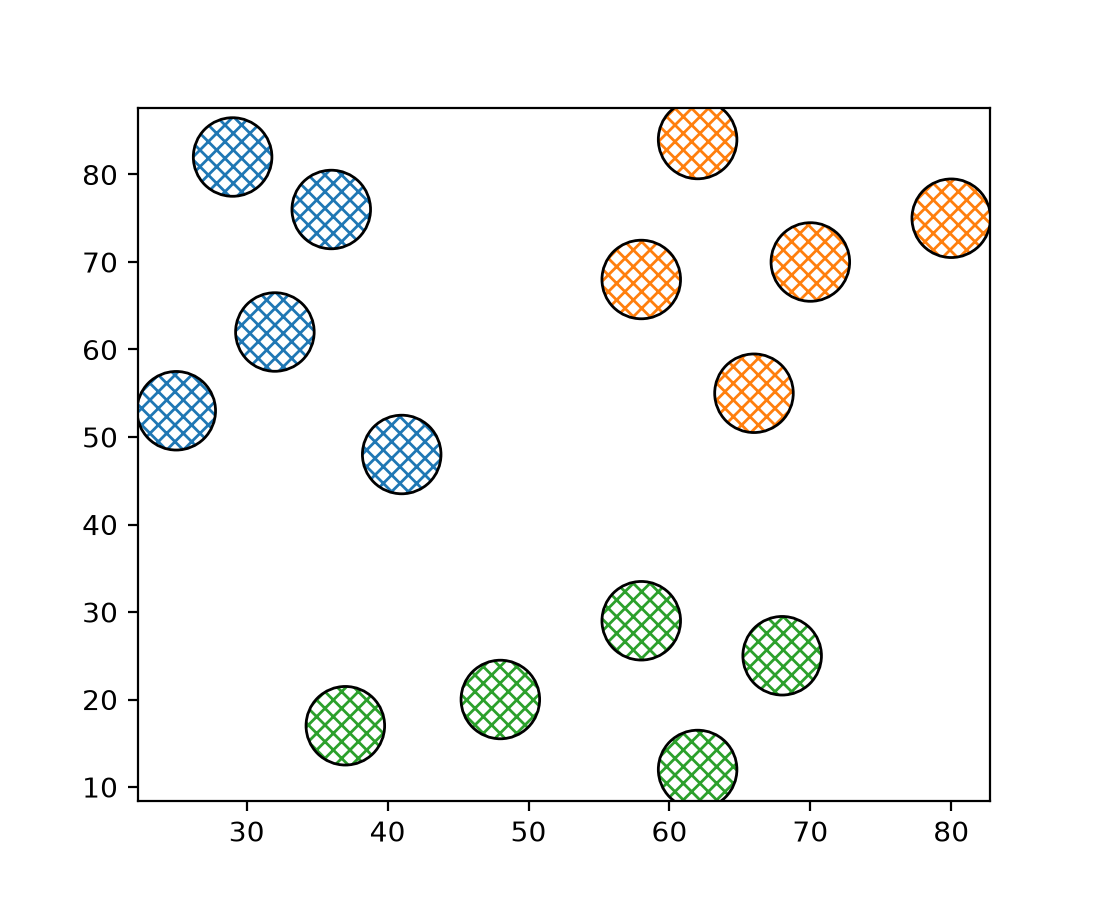
For collections, a sequence of colors can be passed to the hatchcolor parameter which will be cycled through for each hatch, similar to facecolor and edgecolor.
Previously, if edgecolor was not specified, the hatch color would fall back to
rcParams["patch.edgecolor"] (default: 'black'), but the alpha value would default to 1.0, regardless of the
alpha value of the collection. This behavior has been changed such that, if both
hatchcolor and edgecolor are not specified, the hatch color will fall back
to 'patch.edgecolor' with the alpha value of the collection.
import matplotlib.pyplot as plt
import numpy as np

np.random.seed(19680801)

fig, ax = plt.subplots()

x = [29, 36, 41, 25, 32, 70, 62, 58, 66, 80, 58, 68, 62, 37, 48]
y = [82, 76, 48, 53, 62, 70, 84, 68, 55, 75, 29, 25, 12, 17, 20]
colors = ['tab:blue'] * 5 + ['tab:orange'] * 5 + ['tab:green'] * 5

ax.scatter(
    x,
    y,
    s=800,
    hatch="xxxx",
    hatchcolor=colors,
    facecolor="none",
    edgecolor="black",
)

plt.show()
(Source code, 2x.png, png)