RadioButtons and CheckButtons widgets support flexible layouts#
The widgets.RadioButtons and widgets.CheckButtons widgets now support
arranging buttons in different layouts via the new layout parameter. You can
arrange buttons vertically (default), horizontally, or in a 2D grid by passing
a (rows, cols) tuple.
See Radio Buttons Grid for a (rows, cols) example.
import matplotlib.pyplot as plt
import numpy as np
from matplotlib.widgets import CheckButtons
t = np.arange(0.0, 2.0, 0.01)
s0 = np.sin(2*np.pi*t)
s1 = np.sin(4*np.pi*t)
s2 = np.sin(6*np.pi*t)
s3 = np.sin(8*np.pi*t)
fig, axes = plt.subplot_mosaic(
[['main'], ['buttons']],
height_ratios=[8, 1],
layout="constrained",
)
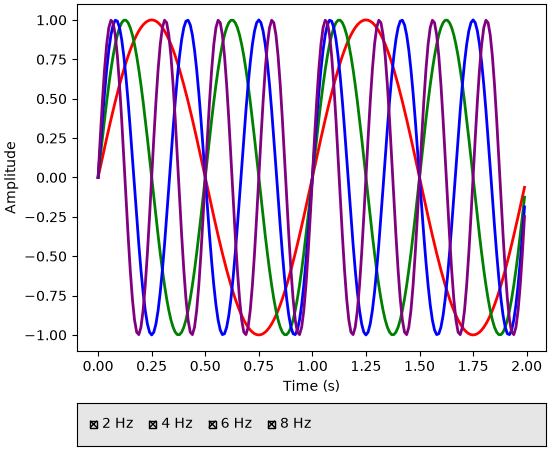
l0, = axes['main'].plot(t, s0, lw=2, color='red', label='2 Hz')
l1, = axes['main'].plot(t, s1, lw=2, color='green', label='4 Hz')
l2, = axes['main'].plot(t, s2, lw=2, color='blue', label='6 Hz')
l3, = axes['main'].plot(t, s3, lw=2, color='purple', label='8 Hz')
axes['main'].set_xlabel('Time (s)')
axes['main'].set_ylabel('Amplitude')
lines_by_label = {l.get_label(): l for l in [l0, l1, l2, l3]}
axes['buttons'].set_facecolor('0.9')
check = CheckButtons(
axes['buttons'],
labels=lines_by_label.keys(),
actives=[l.get_visible() for l in lines_by_label.values()],
layout='horizontal'
)
def callback(label):
ln = lines_by_label[label]
ln.set_visible(not ln.get_visible())
fig.canvas.draw_idle()
check.on_clicked(callback)
plt.show()
(Source code, 2x.png, png)
