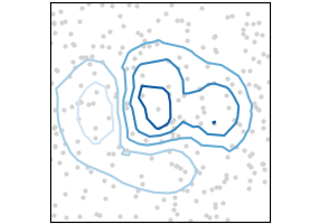
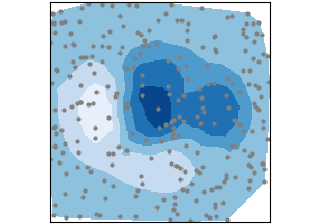
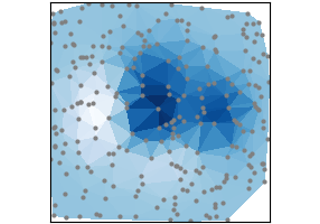
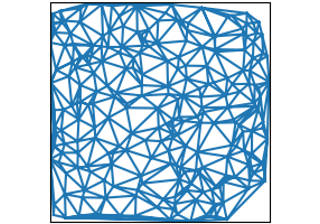
Sometimes we collect data z at coordinates (x,y) and want to visualize as a contour. Instead of gridding the data and then using contour, we can use a triangulation algorithm and fill the triangles.
z
(x,y)
contour
tricontour(x, y, z)
tricontourf(x, y, z)
tripcolor(x, y, z)
triplot(x, y)