Note
Click here to download the full example code
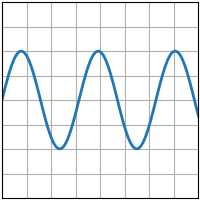
plot(x, y)#
See plot.
Keywords: matplotlib code example, codex, python plot, pyplot Gallery generated by Sphinx-Gallery
Note
Click here to download the full example code
See plot.
Keywords: matplotlib code example, codex, python plot, pyplot Gallery generated by Sphinx-Gallery