Note
Click here to download the full example code
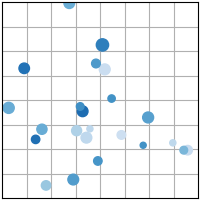
scatter(x, y)#
See scatter.
import matplotlib.pyplot as plt
import numpy as np

plt.style.use('_mpl-gallery')

# make the data
np.random.seed(3)
x = 4 + np.random.normal(0, 2, 24)
y = 4 + np.random.normal(0, 2, len(x))
# size and color:
sizes = np.random.uniform(15, 80, len(x))
colors = np.random.uniform(15, 80, len(x))

# plot
fig, ax = plt.subplots()

ax.scatter(x, y, s=sizes, c=colors, vmin=0, vmax=100)

ax.set(xlim=(0, 8), xticks=np.arange(1, 8),
       ylim=(0, 8), yticks=np.arange(1, 8))

plt.show()
Keywords: matplotlib code example, codex, python plot, pyplot Gallery generated by Sphinx-Gallery