Note
Click here to download the full example code
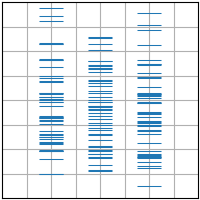
eventplot(D)#
See eventplot.
import matplotlib.pyplot as plt
import numpy as np

plt.style.use('_mpl-gallery')

# make data:
np.random.seed(1)
x = [2, 4, 6]
D = np.random.gamma(4, size=(3, 50))

# plot:
fig, ax = plt.subplots()

ax.eventplot(D, orientation="vertical", lineoffsets=x, linewidth=0.75)

ax.set(xlim=(0, 8), xticks=np.arange(1, 8),
       ylim=(0, 8), yticks=np.arange(1, 8))

plt.show()
Keywords: matplotlib code example, codex, python plot, pyplot Gallery generated by Sphinx-Gallery