Note
Click here to download the full example code
Usage Guide
This tutorial covers some basic usage patterns and best practices to help you get started with Matplotlib.
import matplotlib.pyplot as plt
import numpy as np
A simple example
Matplotlib graphs your data on Figures (e.g., windows, Jupyter
widgets, etc.), each of which can contain one or more Axes, an
area where points can be specified in terms of x-y coordinates, or theta-r
in a polar plot, x-y-z in a 3D plot, etc. The simplest way of
creating a figure with an axes is using pyplot.subplots. We can then use
Axes.plot to draw some data on the axes:
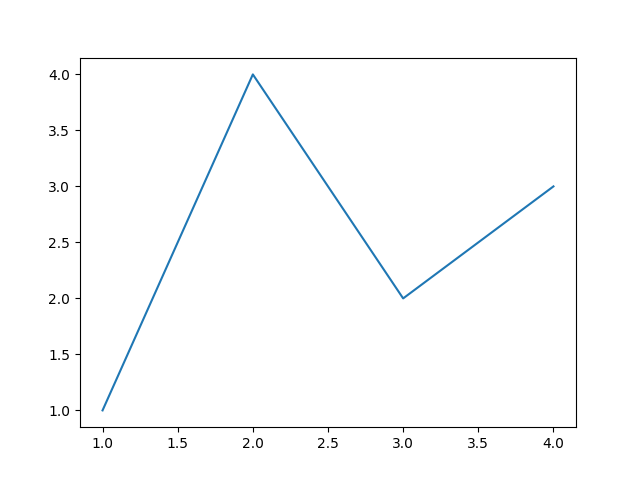
fig, ax = plt.subplots()  # Create a figure containing a single axes.
ax.plot([1, 2, 3, 4], [1, 4, 2, 3])  # Plot some data on the axes.

Out:
[<matplotlib.lines.Line2D object at 0x7fd1df0a02b0>]
Many other plotting libraries or languages do not require you to explicitly create an axes. For example, in MATLAB, one can just do
plot([1, 2, 3, 4], [1, 4, 2, 3]) % MATLAB plot.
and get the desired graph.
In fact, you can do the same in Matplotlib: for each Axes graphing
method, there is a corresponding function in the matplotlib.pyplot
module that performs that plot on the "current" axes, creating that axes (and
its parent figure) if they don't exist yet. So, the previous example can be
written more shortly as
plt.plot([1, 2, 3, 4], [1, 4, 2, 3]) # Matplotlib plot.
Out:
[<matplotlib.lines.Line2D object at 0x7fd1e5b59c40>]
Parts of a Figure
Here is a more detailed layout of the components of a Matplotlib figure.
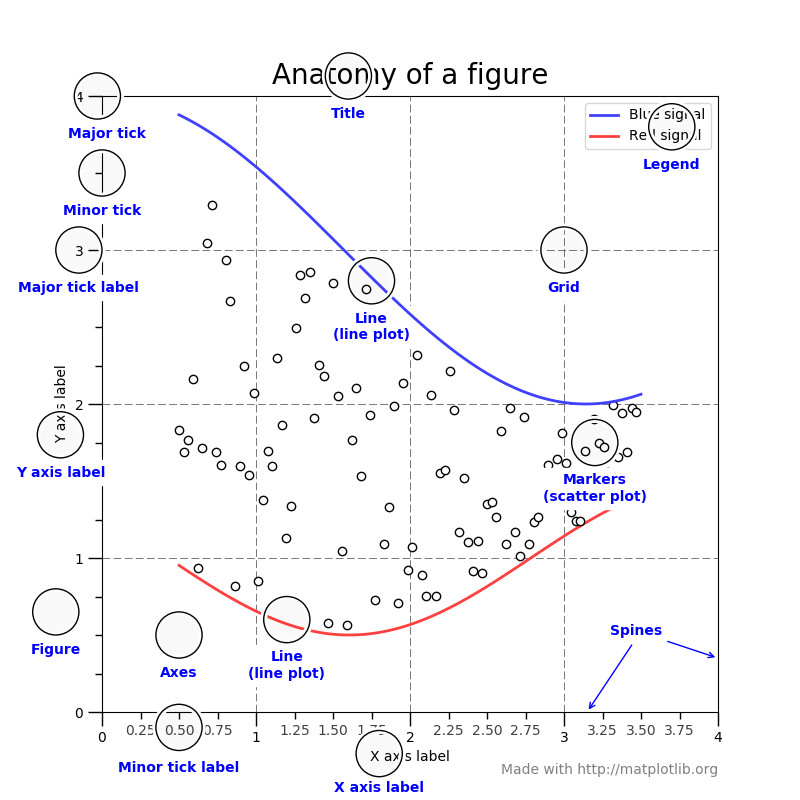
Figure
The whole figure. The figure keeps
track of all the child Axes, a group of
'special' artists (titles, figure legends, etc), and the canvas.
(The canvas is not the primary focus. It is crucial as it is the
object that actually does the drawing to get you your plot, but as
the user, it is mostly invisible to you). A figure can contain any
number of Axes, but will typically have
at least one.
The easiest way to create a new figure is with pyplot:
fig = plt.figure()  # an empty figure with no Axes
fig, ax = plt.subplots()  # a figure with a single Axes
fig, axs = plt.subplots(2, 2)  # a figure with a 2x2 grid of Axes
It's convenient to create the axes together with the figure, but you can also add axes later on, allowing for more complex axes layouts.
Axes
This is what you think of as 'a plot'. It is the region of the image
with the data space. A given figure
can contain many Axes, but a given Axes
object can only be in one Figure. The
Axes contains two (or three in the case of 3D)
Axis objects (be aware of the difference
between Axes and Axis) which take care of the data limits (the
data limits can also be controlled via the axes.Axes.set_xlim() and
axes.Axes.set_ylim() methods). Each Axes has a title
(set via set_title()), an x-label (set via
set_xlabel()), and a y-label set via
set_ylabel()).
The Axes class and its member functions are the primary entry
point to working with the OO interface.
Axis
These are the objects most similar to a number line.
They set graph limits and generate ticks (the marks
on the axis) and ticklabels (strings labeling the ticks). The location of
the ticks is determined by a Locator object and the
ticklabel strings are formatted by a Formatter. The
combination of the correct Locator and Formatter gives very fine
control over the tick locations and labels.
Artist
Basically, everything visible on the figure is an artist (even
Figure, Axes, and Axis objects). This includes
Text objects, Line2D objects, collections objects, Patch
objects, etc... When the figure is rendered, all of the
artists are drawn to the canvas. Most Artists are tied to an Axes; such
an Artist cannot be shared by multiple Axes, or moved from one to another.
Types of inputs to plotting functions
All of plotting functions expect numpy.array or numpy.ma.masked_array as
input. Classes that are similar to arrays ('array-like') such as pandas
data objects and numpy.matrix may not work as intended. Common convention
is to convert these to numpy.array objects prior to plotting.
For example, to convert a pandas.DataFrame
a = pandas.DataFrame(np.random.rand(4, 5), columns = list('abcde'))
a_asarray = a.values
and to convert a numpy.matrix
b = np.matrix([[1, 2], [3, 4]])
b_asarray = np.asarray(b)
The object-oriented interface and the pyplot interface
As noted above, there are essentially two ways to use Matplotlib:
Explicitly create figures and axes, and call methods on them (the "object-oriented (OO) style").
Rely on pyplot to automatically create and manage the figures and axes, and use pyplot functions for plotting.
So one can do (OO-style)
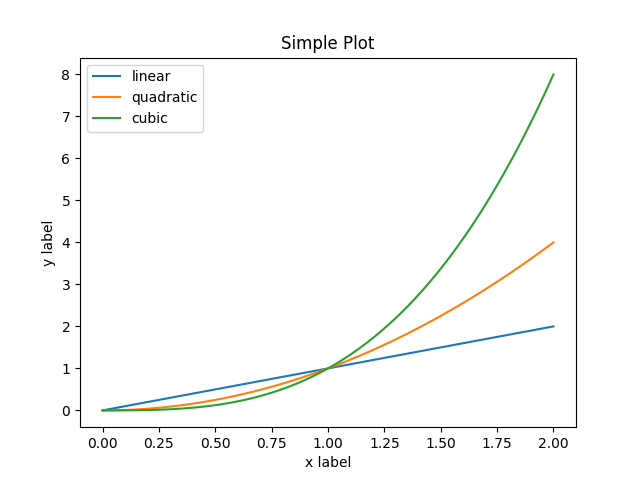
x = np.linspace(0, 2, 100)  # Sample data.

# Note that even in the OO-style, we use `.pyplot.figure` to create the figure.
fig, ax = plt.subplots()  # Create a figure and an axes.
ax.plot(x, x, label='linear')  # Plot some data on the axes.
ax.plot(x, x**2, label='quadratic')  # Plot more data on the axes...
ax.plot(x, x**3, label='cubic')  # ... and some more.
ax.set_xlabel('x label')  # Add an x-label to the axes.
ax.set_ylabel('y label')  # Add a y-label to the axes.
ax.set_title("Simple Plot")  # Add a title to the axes.
ax.legend()  # Add a legend.
Out:
<matplotlib.legend.Legend object at 0x7fd1ded19280>
or (pyplot-style)
x = np.linspace(0, 2, 100)  # Sample data.

plt.plot(x, x, label='linear')  # Plot some data on the (implicit) axes.
plt.plot(x, x**2, label='quadratic')  # etc.
plt.plot(x, x**3, label='cubic')
plt.xlabel('x label')
plt.ylabel('y label')
plt.title("Simple Plot")
plt.legend()

Out:
<matplotlib.legend.Legend object at 0x7fd1e5dfc2e0>
In addition, there is a third approach, for the case when embedding Matplotlib in a GUI application, which completely drops pyplot, even for figure creation. We won't discuss it here; see the corresponding section in the gallery for more info (Embedding Matplotlib in graphical user interfaces).
Matplotlib's documentation and examples use both the OO and the pyplot approaches (which are equally powerful), and you should feel free to use either (however, it is preferable pick one of them and stick to it, instead of mixing them). In general, we suggest to restrict pyplot to interactive plotting (e.g., in a Jupyter notebook), and to prefer the OO-style for non-interactive plotting (in functions and scripts that are intended to be reused as part of a larger project).
Note
In older examples, you may find examples that instead used the so-called
pylab interface, via from pylab import *. This star-import
imports everything both from pyplot and from numpy, so that one
could do
for an even more MATLAB-like style. This approach is strongly discouraged nowadays and deprecated. It is only mentioned here because you may still encounter it in the wild.
If you need to make the same plots over and over again with different data sets, use the recommended signature function below.
def my_plotter(ax, data1, data2, param_dict):
    """
    A helper function to make a graph

    Parameters
    ----------
    ax : Axes
        The axes to draw to

    data1 : array
       The x data

    data2 : array
       The y data

    param_dict : dict
       Dictionary of keyword arguments to pass to ax.plot

    Returns
    -------
    out : list
        list of artists added
    """
    out = ax.plot(data1, data2, **param_dict)
    return out
which you would then use as:
data1, data2, data3, data4 = np.random.randn(4, 100)
fig, ax = plt.subplots(1, 1)
my_plotter(ax, data1, data2, {'marker': 'x'})
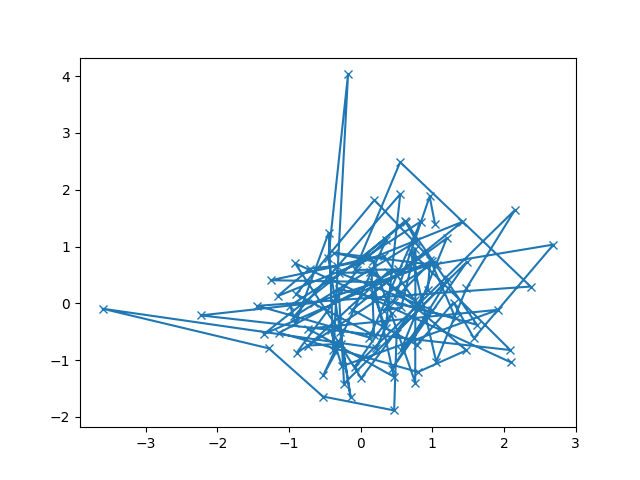
Out:
[<matplotlib.lines.Line2D object at 0x7fd1ed1c05b0>]
or if you wanted to have two sub-plots:
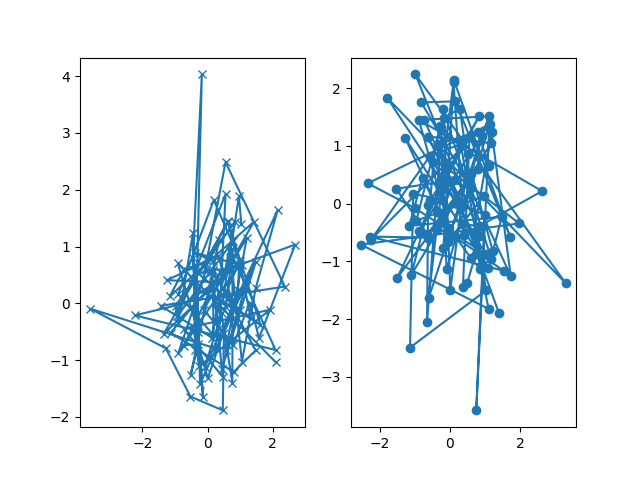
Out:
[<matplotlib.lines.Line2D object at 0x7fd1ed2b3be0>]
These examples provide convenience for more complex graphs.
Total running time of the script: ( 0 minutes 3.227 seconds)
Keywords: matplotlib code example, codex, python plot, pyplot Gallery generated by Sphinx-Gallery