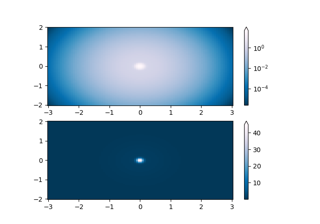
matplotlib.colors.LogNorm#
- class matplotlib.colors.LogNorm(vmin=None, vmax=None, clip=False)[source]#
Bases:
NormalizeNormalize a given value to the 0-1 range on a log scale.
- Parameters:
- vmin, vmaxfloat or None
If vmin and/or vmax is not given, they are initialized from the minimum and maximum value, respectively, of the first input processed; i.e.,
__call__(A)callsautoscale_None(A).- clipbool, default: False
If
Truevalues falling outside the range[vmin, vmax], are mapped to 0 or 1, whichever is closer, and masked values are set to 1. IfFalsemasked values remain masked.Clipping silently defeats the purpose of setting the over, under, and masked colors in a colormap, so it is likely to lead to surprises; therefore the default is
clip=False.
Notes
Returns 0 if
vmin == vmax.- __call__(value, clip=None)[source]#
Normalize value data in the
[vmin, vmax]interval into the[0.0, 1.0]interval and return it.- Parameters:
- value
Data to normalize.
- clipbool, optional
If
None, defaults toself.clip(which defaults toFalse).
Notes
If not already initialized,
self.vminandself.vmaxare initialized usingself.autoscale_None(value).