Note
Click here to download the full example code
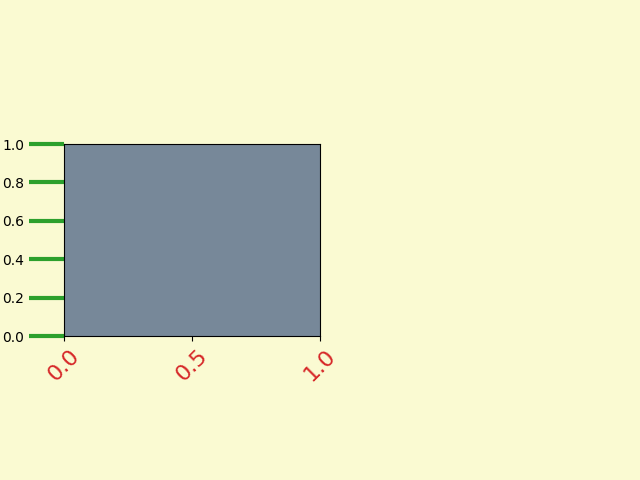
Fig Axes Customize Simple#
Customize the background, labels and ticks of a simple plot.
import matplotlib.pyplot as plt
pyplot.figure creates a matplotlib.figure.Figure instance.
fig = plt.figure()
rect = fig.patch  # a rectangle instance
rect.set_facecolor('lightgoldenrodyellow')

ax1 = fig.add_axes([0.1, 0.3, 0.4, 0.4])
rect = ax1.patch
rect.set_facecolor('lightslategray')

ax1.tick_params(axis='x', labelcolor='tab:red', labelrotation=45, labelsize=16)
ax1.tick_params(axis='y', color='tab:green', size=25, width=3)

plt.show()
References
The use of the following functions, methods, classes and modules is shown in this example: