Note
Click here to download the full example code
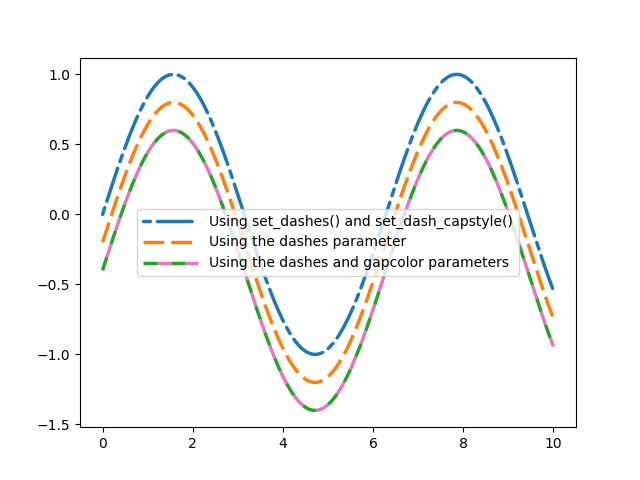
Customizing dashed line styles#
The dashing of a line is controlled via a dash sequence. It can be modified
using Line2D.set_dashes.
The dash sequence is a series of on/off lengths in points, e.g.
[3, 1] would be 3pt long lines separated by 1pt spaces.
Some functions like Axes.plot support passing Line properties as keyword
arguments. In such a case, you can already set the dashing when creating the
line.
Note: The dash style can also be configured via a property_cycle by passing a list of dash sequences using the keyword dashes to the cycler. This is not shown within this example.
Other attributes of the dash may also be set either with the relevant method
(set_dash_capstyle, set_dash_joinstyle,
set_gapcolor) or by passing the property through a plotting
function.
import numpy as np
import matplotlib.pyplot as plt

x = np.linspace(0, 10, 500)
y = np.sin(x)

plt.rc('lines', linewidth=2.5)
fig, ax = plt.subplots()

# Using set_dashes() and set_capstyle() to modify dashing of an existing line.
line1, = ax.plot(x, y, label='Using set_dashes() and set_dash_capstyle()')
line1.set_dashes([2, 2, 10, 2])  # 2pt line, 2pt break, 10pt line, 2pt break.
line1.set_dash_capstyle('round')

# Using plot(..., dashes=...) to set the dashing when creating a line.
line2, = ax.plot(x, y - 0.2, dashes=[6, 2], label='Using the dashes parameter')

# Using plot(..., dashes=..., gapcolor=...) to set the dashing and
# alternating color when creating a line.
line3, = ax.plot(x, y - 0.4, dashes=[4, 4], gapcolor='tab:pink',
                 label='Using the dashes and gapcolor parameters')

ax.legend(handlelength=4)
plt.show()