Note
Click here to download the full example code
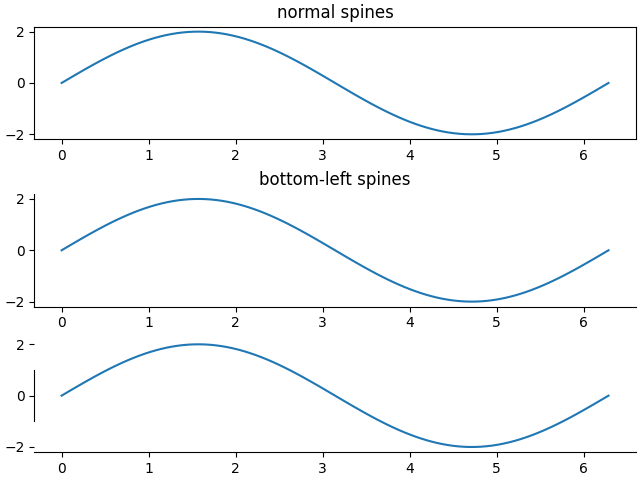
Spines#
This demo compares:
normal Axes, with spines on all four sides;
an Axes with spines only on the left and bottom;
an Axes using custom bounds to limit the extent of the spine.
Each axes.Axes has a list of Spine objects, accessible
via the container ax.spines.
import numpy as np
import matplotlib.pyplot as plt


x = np.linspace(0, 2 * np.pi, 100)
y = 2 * np.sin(x)

# Constrained layout makes sure the labels don't overlap the axes.
fig, (ax0, ax1, ax2) = plt.subplots(nrows=3, constrained_layout=True)

ax0.plot(x, y)
ax0.set_title('normal spines')

ax1.plot(x, y)
ax1.set_title('bottom-left spines')

# Hide the right and top spines
ax1.spines.right.set_visible(False)
ax1.spines.top.set_visible(False)
# Only show ticks on the left and bottom spines
ax1.yaxis.set_ticks_position('left')
ax1.xaxis.set_ticks_position('bottom')

ax2.plot(x, y)

# Only draw spine between the y-ticks
ax2.spines.left.set_bounds(-1, 1)
# Hide the right and top spines
ax2.spines.right.set_visible(False)
ax2.spines.top.set_visible(False)
# Only show ticks on the left and bottom spines
ax2.yaxis.set_ticks_position('left')
ax2.xaxis.set_ticks_position('bottom')

plt.show()

# .. admonition:: References
#
#    The use of the following functions, methods, classes and modules is shown
#    in this example:
#
#    - `matplotlib.Spines.set_visible`
#    - `matplotlib.Spines.set_bounds`
#    - `matplotlib.axis.set_ticks_position`