Version 3.0.0
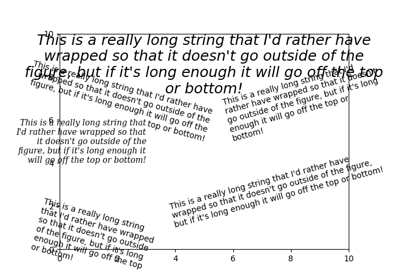
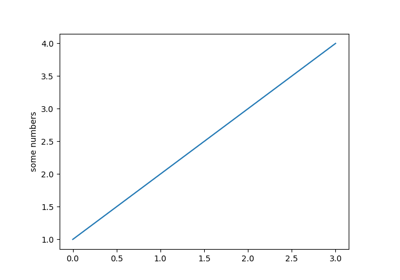
matplotlib.pyplot.text(x, y, s, fontdict=None, withdash=False, **kwargs)[source]¶Add text to the axes.
Add the text s to the axes at location x, y in data coordinates.
| Parameters: |
|
|---|---|
| Returns: | |
| Other Parameters: |
|
Examples
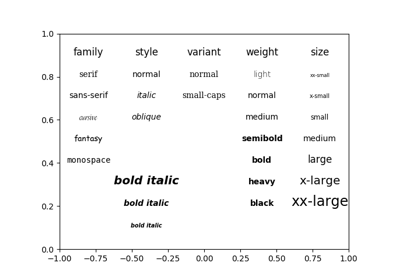
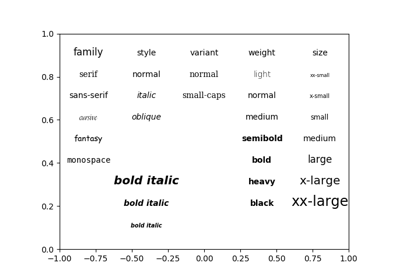
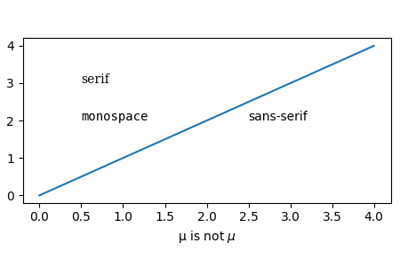
Individual keyword arguments can be used to override any given parameter:
>>> text(x, y, s, fontsize=12)
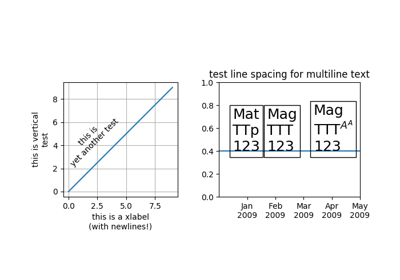
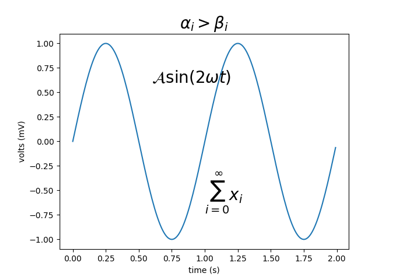
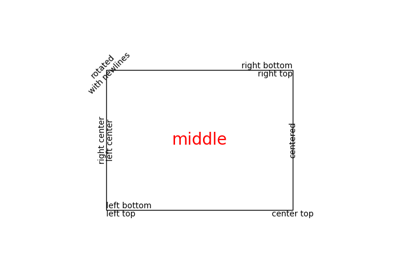
The default transform specifies that text is in data coords, alternatively, you can specify text in axis coords (0,0 is lower-left and 1,1 is upper-right). The example below places text in the center of the axes:
>>> text(0.5, 0.5, 'matplotlib', horizontalalignment='center',
...      verticalalignment='center', transform=ax.transAxes)
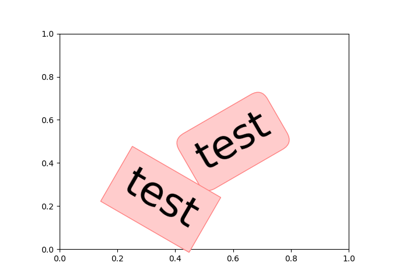
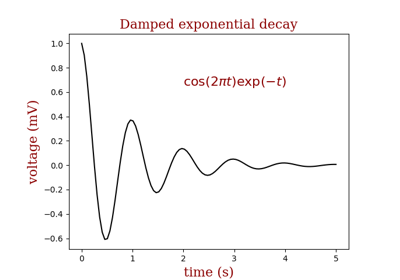
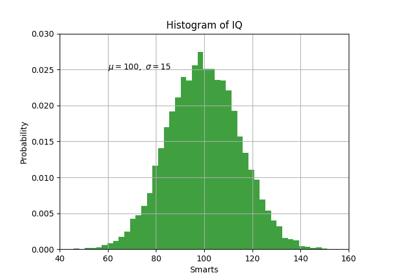
You can put a rectangular box around the text instance (e.g., to
set a background color) by using the keyword bbox. bbox is
a dictionary of Rectangle
properties. For example:
>>> text(x, y, s, bbox=dict(facecolor='red', alpha=0.5))
matplotlib.pyplot.text