Version 3.0.0
Note
Click here to download the full example code
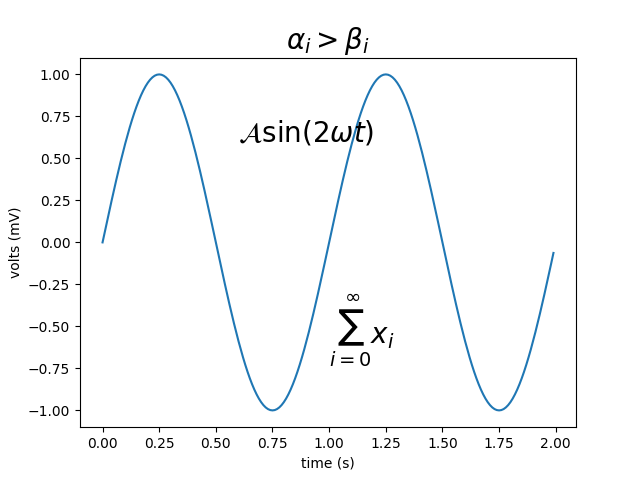
Use mathematical expressions in text labels. For an overview over MathText see Writing mathematical expressions.
import numpy as np
import matplotlib.pyplot as plt
t = np.arange(0.0, 2.0, 0.01)
s = np.sin(2*np.pi*t)

plt.plot(t,s)
plt.title(r'$\alpha_i > \beta_i$', fontsize=20)
plt.text(1, -0.6, r'$\sum_{i=0}^\infty x_i$', fontsize=20)
plt.text(0.6, 0.6, r'$\mathcal{A}\mathrm{sin}(2 \omega t)$',
         fontsize=20)
plt.xlabel('time (s)')
plt.ylabel('volts (mV)')
plt.show()
The use of the following functions, methods, classes and modules is shown in this example:
import matplotlib
matplotlib.pyplot.text
matplotlib.axes.Axes.text
Keywords: matplotlib code example, codex, python plot, pyplot Gallery generated by Sphinx-Gallery