Version 3.0.0
Note
Click here to download the full example code
import matplotlib.pyplot as plt
import numpy as np
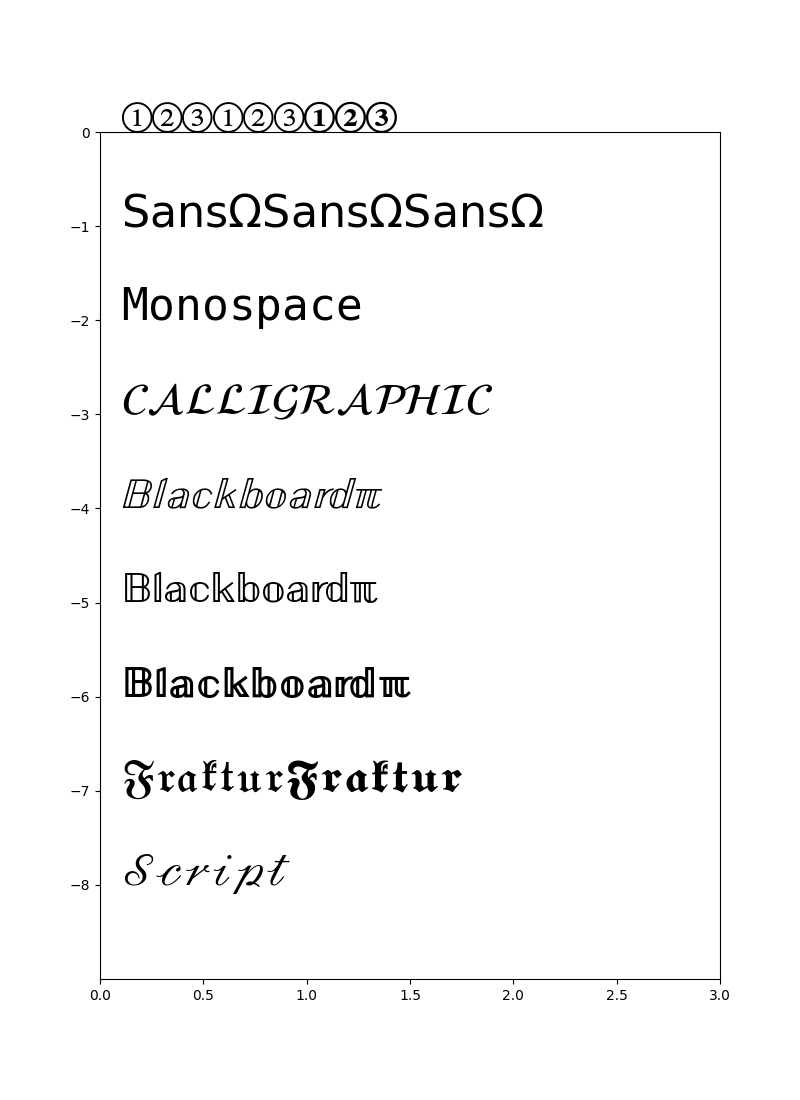
tests = [
r'$\mathcircled{123} \mathrm{\mathcircled{123}}'
r' \mathbf{\mathcircled{123}}$',
r'$\mathsf{Sans \Omega} \mathrm{\mathsf{Sans \Omega}}'
r' \mathbf{\mathsf{Sans \Omega}}$',
r'$\mathtt{Monospace}$',
r'$\mathcal{CALLIGRAPHIC}$',
r'$\mathbb{Blackboard \pi}$',
r'$\mathrm{\mathbb{Blackboard \pi}}$',
r'$\mathbf{\mathbb{Blackboard \pi}}$',
r'$\mathfrak{Fraktur} \mathbf{\mathfrak{Fraktur}}$',
r'$\mathscr{Script}$']
plt.figure(figsize=(8, (len(tests) * 1) + 2))
plt.plot([0, 0], 'r')
plt.axis([0, 3, -len(tests), 0])
plt.yticks(-np.arange(len(tests)))
for i, s in enumerate(tests):
plt.text(0.1, -i, s, fontsize=32)
plt.show()
Keywords: matplotlib code example, codex, python plot, pyplot Gallery generated by Sphinx-Gallery