Art from UNC BIOL222
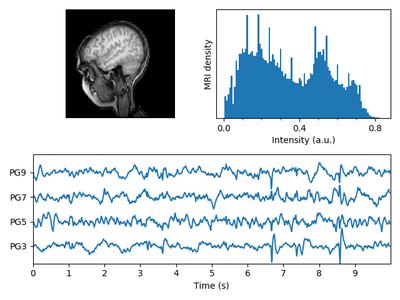
UNC BIOL222: Art created with Matplotlib
Posted
#art #academia

UNC BIOL222: Art created with Matplotlib
Posted
#art #academia
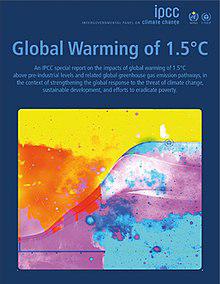
Many figures in the IPCC SR15 were generated using Matplotlib. The data and open-source notebooks were published to increase the transparency and reproducibility of the analysis.
Posted
#academia #tutorials

Ed Hawkins made this impressively simple plot to show how global temperatures have risen since 1880. Here is how to recreate it using Matplotlib.
Posted
#tutorials #academia
Advocating is all about communicating facts clearly. I used Matplotlib to show the financial struggles of postdocs in the Boston area.
Posted
#academia